Transport and Travel in Scotland 2015 - 27 September 2016
5. Motor Vehicles, Traffic And Driving
This section contains analysis and headline findings from the Scottish Household Survey questions on driving and car access (including the Travel Diary part of the survey), as well as comparisons with data from a range of other sources.
Driving Licences
Sixty eight percent of the population (17+) had a driving licence in 2015, the same proportion as in 2014. [Table SUM1 and Table 1]
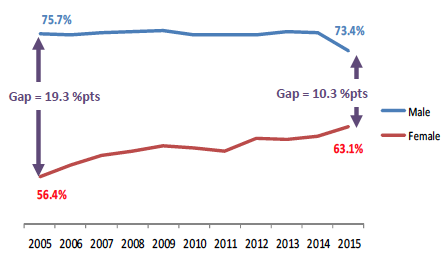
Three quarters (73%) of men aged 17+ had a driving licence, compared to 63 percent of women. There has been a narrowing of this gap over the years of the survey. [Table 1 and Figure 2]
Figure 2 – Driving licence possession by gender
Driving licence possession was lowest amongst younger and older people (17-19: 26% and 80+: 43%) and highest amongst those aged 40-49 (81%). [Table 1]
Driving licence possession increased with net annual household income (45% for adults in households with less than £10,000 of income compared to 89% in households with an income over £40,000). [Table 19]
Driving licence possession increases with rurality (61% of adults in large urban areas have a driving licence, compared to 81% of those in remote rural areas). [Table 19]
Car And Van Access
Seventy percent of households had access to one or more cars or vans for private use in 2015. Around a quarter (27%) of households had access to two or more cars (or vans). These proportions are similar to 2014. [Tables 18 &SUM1]
The proportion of households with access to a car was higher in households with a higher net annual income; the number of cars the household had access to was also higher in higher income households; 64% of households with an annual income of more than £40,000 had access to two or more cars, compared to 8 percent of households with an annual income of less than £10,000. [Table 18]
Households in rural areas were more likely to have access to a car than those in urban areas, and households in rural areas were also more likely to have access to more than one car than households in urban areas. [Table 18]
Frequency Of Driving
Sixty one percent of those aged 17+ drove at least once a week in 2015, with 41 percent driving every day. [Tables 3 & SUM1]
Frequency of driving increased with income and with rurality. Thirty four percent of adults in large urban areas drove every day compared to forty eight percent of adults in remote rural areas. Eighteen percent of adults living in households with a total annual income of under £10,000 drove every day, compared to sixty two percent of those who lived in households with a total annual income of over £40,000. [Table 20]
Car Occupancy
The average car occupancy was 1.5 people in 2015; the rate has remained similar in recent years. The proportion of single occupancy journeys has seen increases in recent years and accounted for around two thirds (65%) of car journeys in 2015, an increase from 61% in 2005. [Table TD9]
Fuel Spend
The average amount which households spent on fuel in the last month fell sharply between 2014 and 2015, from £123.70 to £109.2, with the median figure dropping from £100 to £80. [Table 2]
Licensed Vehicles
There were 268,200 new vehicles registered in Scotland in 2015, the highest number of new registrations since the peak of 228,300 in 2003. [Table SUM2]
The number of vehicles licensed for use on the roads increased by 1.5 percent from 2.82 million to 2.86 million between 2014 and 2015. [Table SUM2]
More detailed statistics on vehicles licensed in Scotland can be found in the Road Transport Vehicles Chapter of Scottish Transport Statistics.
Road Network
There were 55,990 km of road in Scotland in 2014. Of this, 6.4 percent (3,570 km) is Trunk road, the remaining 52,420 km are managed by Local Authorities. There has been an increase in road length of one percent over the last five years.These figures have not yet been updated for 2015.[Table SUM2]
More detailed statistics on the road network in Scotland can be found in the Road Network chapter of Scottish Transport Statistics.
Road Traffic
The estimated volume of traffic on Scotland’s roads was at its highest ever - 45.4 billion vehicle kilometres in 2015, an increase of 1 percent on 2014 and slightly above the previous recent peak in 2007 of 44.7 billion. [Table SUM2] More detailed statistics on road traffic in Scotland can be found in the Road Traffic chapter of Scottish Transport Statistics.
Reported Road Casualties
Provisional figures show a total of 10,950 road casualties reported to the police in 2015 (357 fewer than in 2014), the lowest figure since records began in 1950. Of these, there were 162 fatalities; 41 fewer than in 2014. There were 1,759 serious injuries; 107 fewer than in 2014 and 9,191 slightly injured: 209 fewer than in 2014. More detailed statistics can be found in Key Reported Road Casualties.