Transport and Travel in Scotland 2015 - 27 September 2016
7. Walking and Cycling
This section contains analysis and headline findings from the Scottish Household Survey questions on cycling and walking (including the Travel Diary part of the survey).
Cycling
Distance cycled on all roads is estimated to have decreased from 369 million vehicle kilometres in 2014 to 342 million vehicle kilometres in 2015. [DfT traffic estimates 2015] Traffic estimates indicate only the broad level of traffic, so year-on-year comparisons should be made with caution as they are estimated based on a small cross-section of Scottish roads.
One percent of journeys had cycling as the main mode of transport, a similar proportion to 2014. [Table SUM1 & TD2] The average (mean) cycling journey was 4.7 km in length. [Table TD5a]
Just over two (2.2) percent of adults usually cycle to work, compared to 2.6 percent in 2014. Just over one percent (1.2%) of children cycled to school in 2015. [Tables 7, 15 & SUM1]
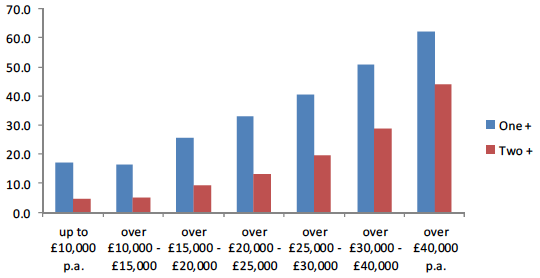
Figure 3: Percentage of households with access to more than one or more than two bikes by annual household income, 2015
When asked why they don’t cycle to work, the main reason given was ‘it’s too far’ (33%) followed by ‘too many cars on the road’ (18%). Sixteen percent don’t cycle because of bad weather and twelve percent said that traffic travelled too fast. This question was not asked in 2015 so data in this paragraph refer to 2014,[Table 26]
Bicycle access
A third (35%) of households had access to at least one bicycle for adult use in 2015. Eighteen percent had access to two or more. [Table 18]
Household access to bikes increased with household income and household size (two thirds of households with an income of £40,000 or more have access to one or more bikes). Bicycle access was higher in rural areas than urban areas. [Table 18]
Walking
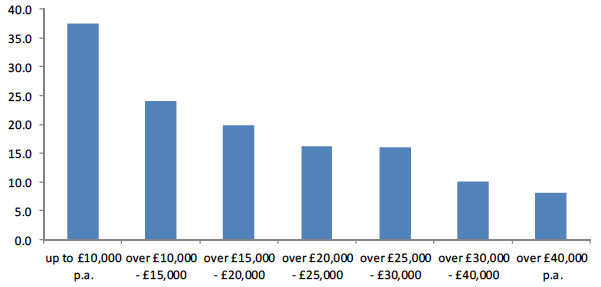
Twenty two percent of journeys reported in the SHS travel diary in 2015 had walking as the main mode of transport. Fourteen percent of adults usually walk to work and 49 percent of children usually walk to school as their main mode of transport. [Tables 7, 15, TD2 & SUM1]
The average walking journey was 1.0 km in length. [Table TD5a]
Two thirds of people had walked as a means of transport on at least one day in the previous week. Twenty two percent had walked as a means of transport on 6-7 days. More than half (58%) of people had walked for pleasure at least once in the last week. [Table 3a] Frequency of walking decreased with age (81% of those aged 16-19 had walked to go somewhere in the last week, compared to 39% of those aged 80+). This question was not asked in 2015 so data in this paragraph refer to 2014,[ [Table 25a]
Figure 4: Percentage of adults whose main mode of travel to work was walking by annual household income, 2015
When respondents were asked what discourages them from walking more, the main reasons given, other than nothing (57%) were health and weather (both 15%). This question was not asked in 2015 so data in this paragraph refer to 2014. [Table 43]