Cycle lanes and footways
This section covers the usage of cycle lanes and footways that are alongside trunk roads. Because the base sizes were relatively small, (43 cycle lane users and 91 footway users), the data presented here cannot be said to be representative of the wider population of cycle lane and footway users and should be interpreted with caution.
Satisfaction with cycle lanes
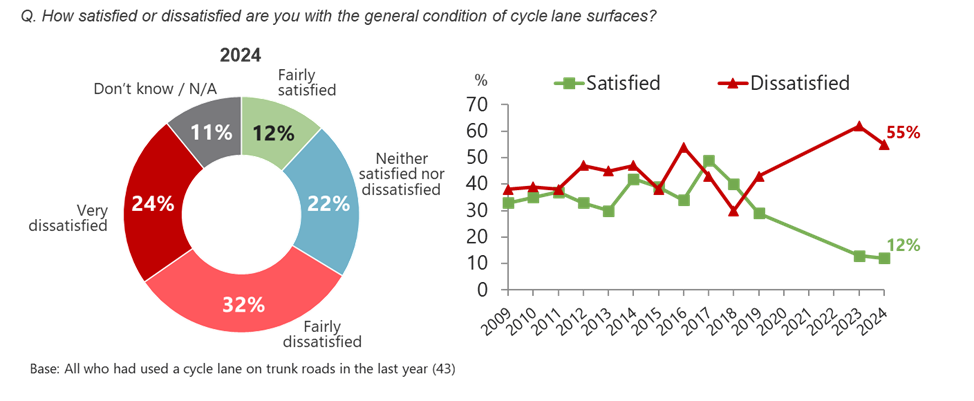
Cyclists were more likely to be dissatisfied than satisfied with the general condition of cycle lane surfaces – 55% were dissatisfied and just 12% satisfied. This was in line with the findings from 2023 (Figure 5.1).
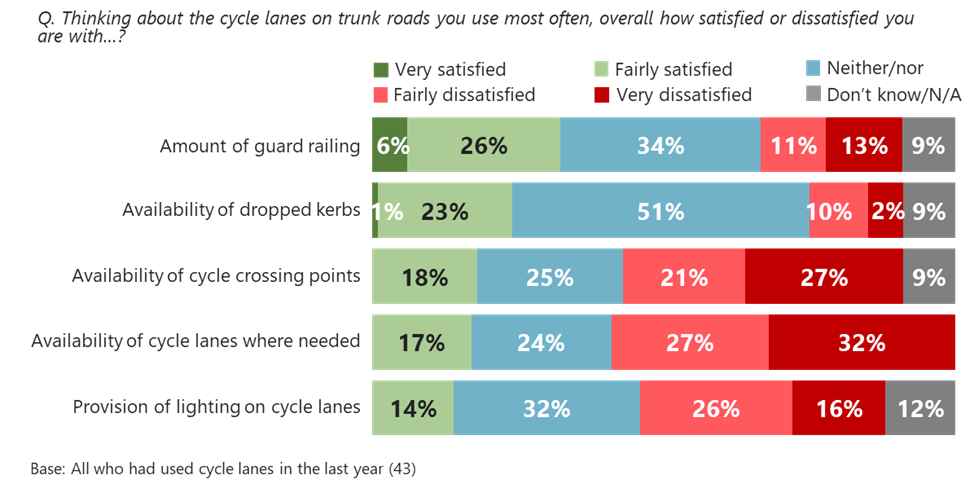
When asked about the specific features of cycle lanes, dissatisfaction was highest for the availability of cycle lanes (59%) and cycle crossing points (48%) (Figure 5.2).
Satisfaction with footways
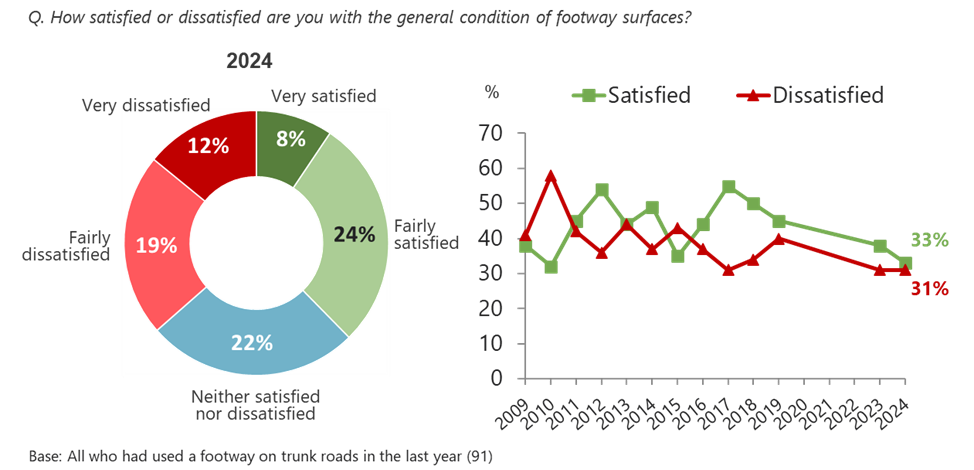
Among those who had used trunk road footways within the past year, around one in three said they were either satisfied or dissatisfied with their general condition, similar to the findings from 2023 (Figure 5.3).
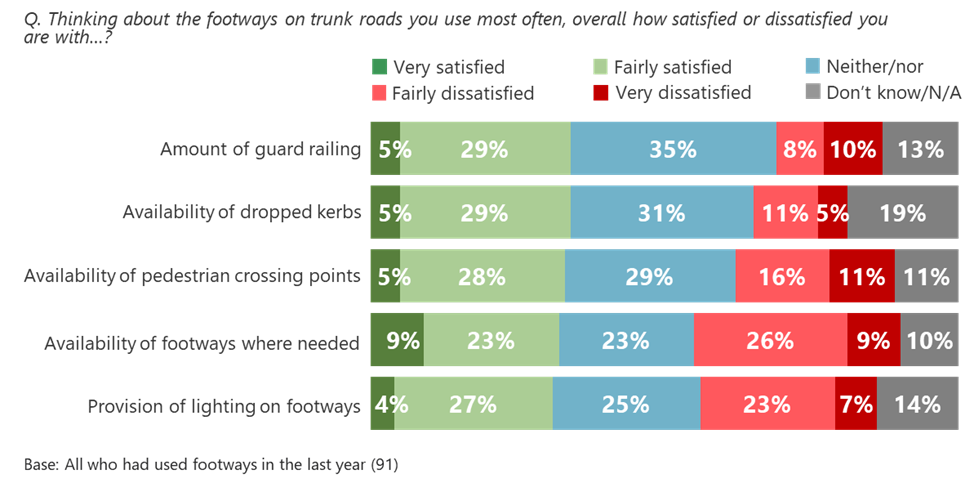
Similar proportions, around one in three, said they were satisfied with the specific aspects of trunk road footways. Dissatisfaction was highest for the availability of footways (35%) and the provision of lighting (30%) (Figure 5.4).