Perceptions of trunk roads
Frequency of use and satisfaction
Participants were asked to select the trunk roads which they travelled on most frequently. The road most used was the M8 (36%), followed by the A90 (18%), M74 (17%), A9 (14%) and M80 (13%).
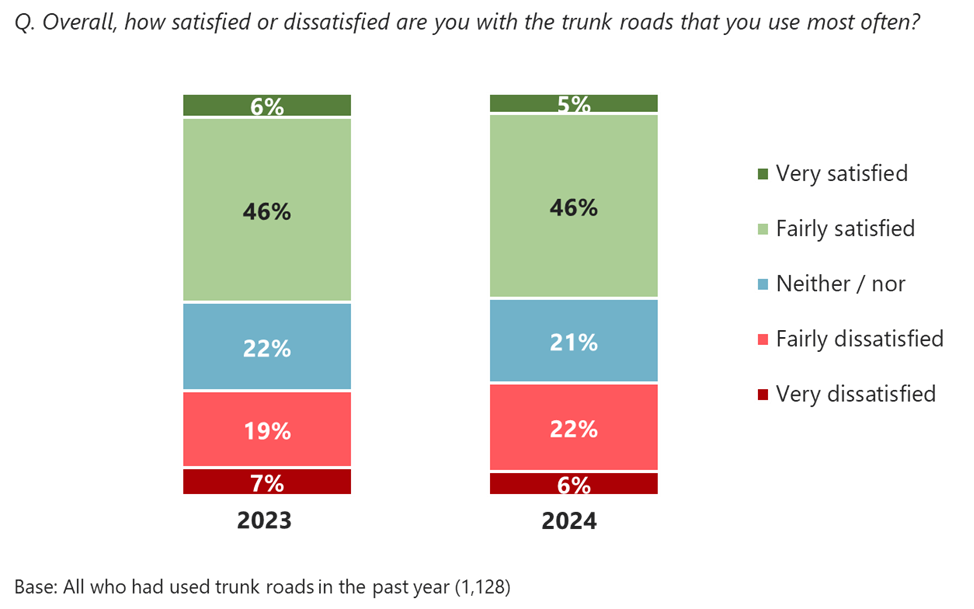
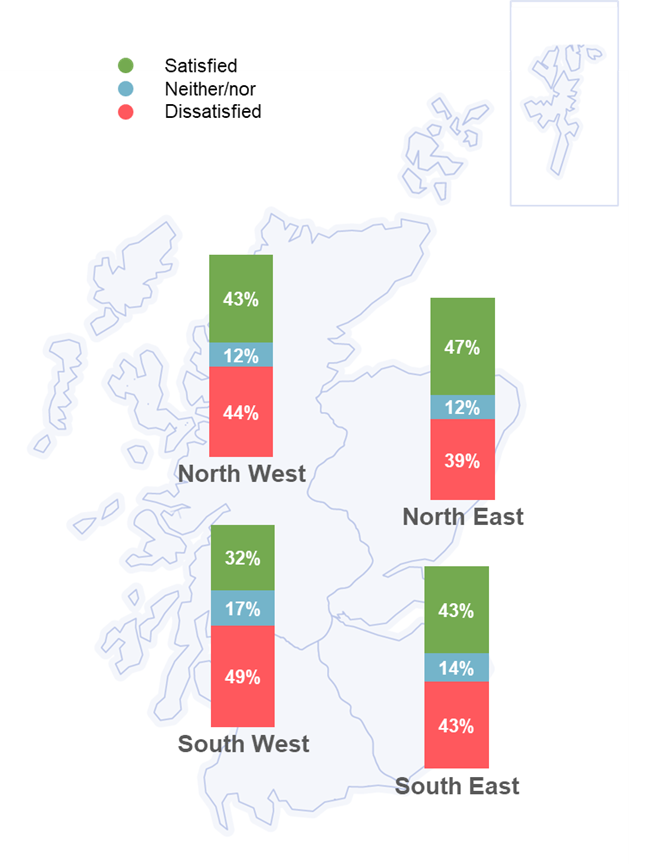
Half of respondents (51%) were satisfied with the trunk roads they used most often, while a just over a quarter (28%) were dissatisfied. This was in line with findings from 2023 (Figure 2.1).
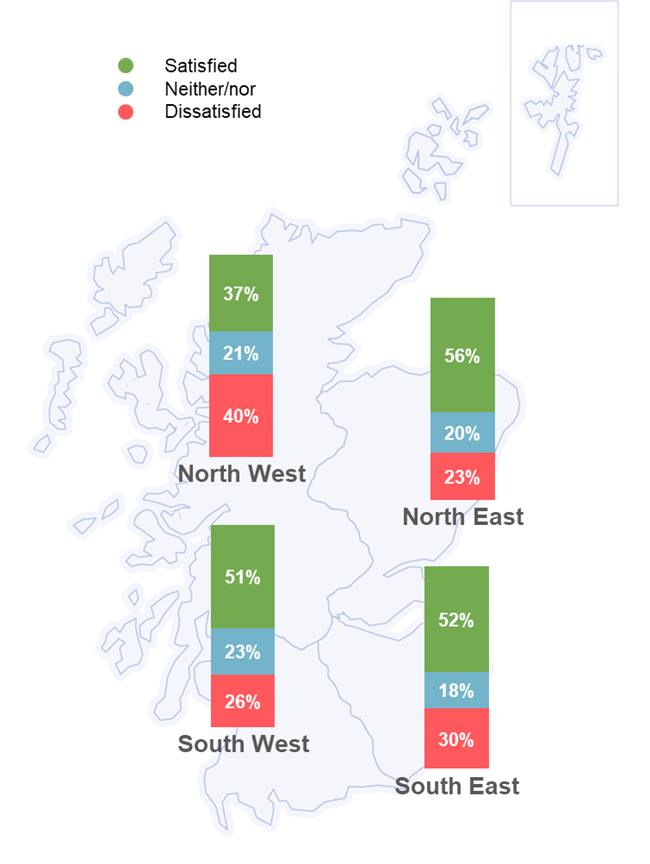
Overall satisfaction was lower than average among respondents in the North West (37%) (Figure 2.2), which mirrored 2023’s findings.
Dissatisfaction was higher among older respondents, with 33% of those aged 65 and older saying they were dissatisfied with the trunk roads they used most often (compared to 14% of those aged 18-24).
Perceived importance of aspects of trunk road management and maintenance
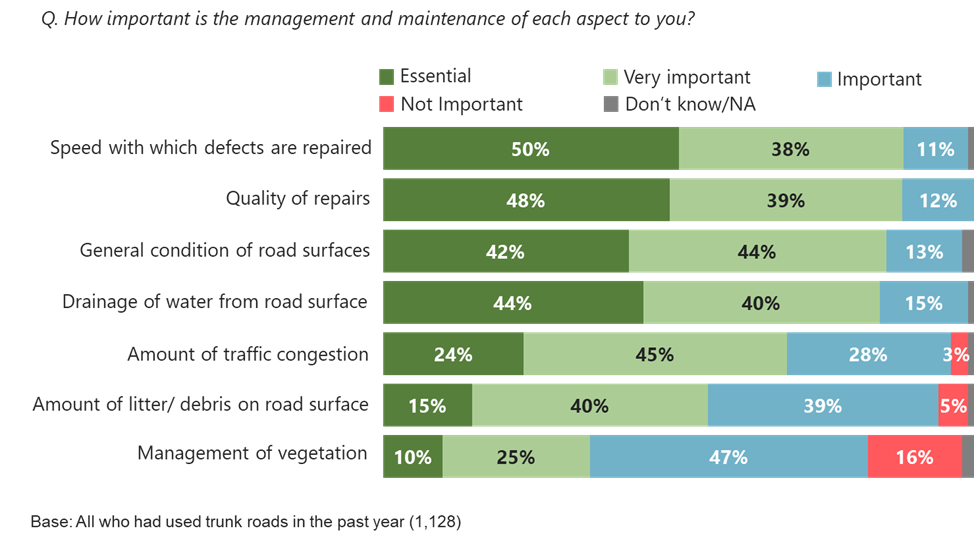
Respondents were shown a list of specific aspects of trunk road management and maintenance. For each aspect, respondents indicated how important they perceived it to be. Consistent with previous years, the aspects which were perceived as most important (rated as either ‘essential’ or ‘very important’) were the speed with which defects are repaired (88%), the quality of repairs (87%), the general condition of road surfaces (86%) and the drainage of water and flooding from road surfaces (83%) (Figure 2.3).
The management of vegetation remained the least important aspect, mentioned by 35% of respondents.
Satisfaction with general condition of trunk roads
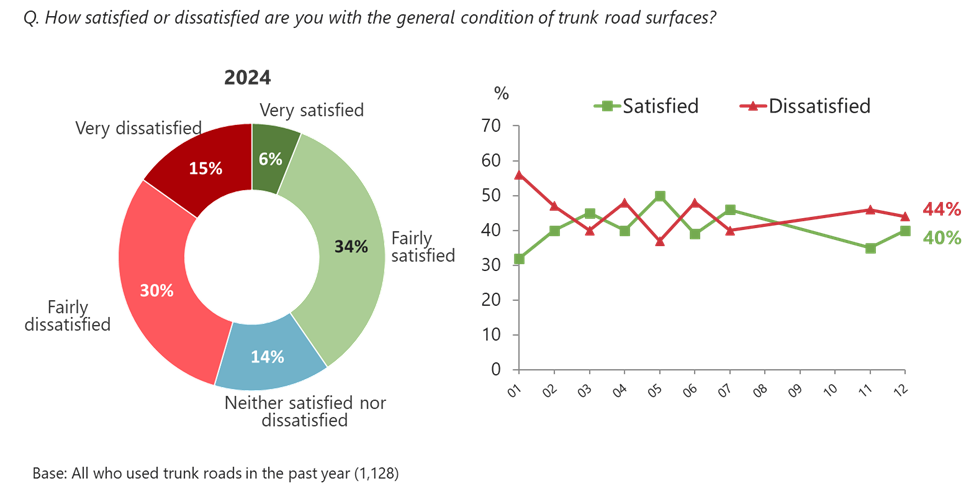
Attitudes towards the general condition of road surfaces were mixed, with four in ten satisfied (40%) and a similar proportion dissatisfied (44%). In comparison with 2023, there was an increase in those saying they were satisfied with the general condition of trunk roads (40%, compared to 35%).
Trunk road users in the North East were more likely than average to be satisfied (47%, compared to 40%), while satisfaction was lowest among those in the South West (32%) (Figure 2.5).
Respondents aged 55 and older were more likely than younger respondents to be dissatisfied with the condition of trunk road surfaces (52%, compared to 31% of those aged under 35).
Respondents who were dissatisfied with the general condition of trunk road surfaces were asked to identify the roads they were most dissatisfied with. The most commonly named road was the M8, selected by a quarter (25%) of users (compared to 17% in 2023). This was followed by the A90 (14%), M74 (10%) and A9 (9%).
Among those who were dissatisfied with the general condition of trunk road surfaces, 82% said they ‘always’, ‘usually’, or ‘sometimes’ encountered defects they regarded as unsafe. Potholes remained the most common defect (55%) (Table 2.1).
| Defects | 2014 | 2015 | 2016 | 2017 | 2018 | 2019 | 2023 | 2024 |
|---|---|---|---|---|---|---|---|---|
| Potholes | 72% | 71% | 71% | 64% | 73% | 69% | 62% | 55% |
| Uneven/bumpy surfaces | 9% | 9% | 10% | 12% | 10% | 12% | 14% | 12% |
| Poor repairs | 8% | 8% | 8% | 10% | 7% | 8% | 12% | 11% |
| Water on roads | 2% | 3% | 2% | 3% | 2% | 3% | 2% | 7% |
| Poor road markings | 1% | 1% | 1% | 2% | 1% | 1% | 2% | 5% |
| Slippery roads caused by ice/snow | 2% | 2% | 2% | 2% | 2% | 2% | 3% | 3% |
| Deterioration of road edge | 1% | 2% | 1% | 2% | 1% | 2% | 1% | 3% |
| Cracking | 1% | 1% | 2% | 2% | 1% | 1% | 1% | 2% |
| Ironwork in need of repair | 1% | 1% | 1% | 1% | 1% | <0.5% | 2% | 1% |
| Poor skid resistance | <0.5% | 1% | <0.5% | 1% | <0.5% | <0.5% | 1% | <0.5% |
| Base: All who had encountered defects | 885 | 723 | 895 | 643 | 878 | 753 | 605 | 517 |
Respondents who had experienced at least one defect were asked about the specific road they encountered these on. The most commonly mentioned roads were the M8 (19%), A90 (16%), A9 (10%) and M74 (10%), the roads travelled on most frequently by trunk roads users.
Satisfaction with other aspects of trunk road management and maintenance
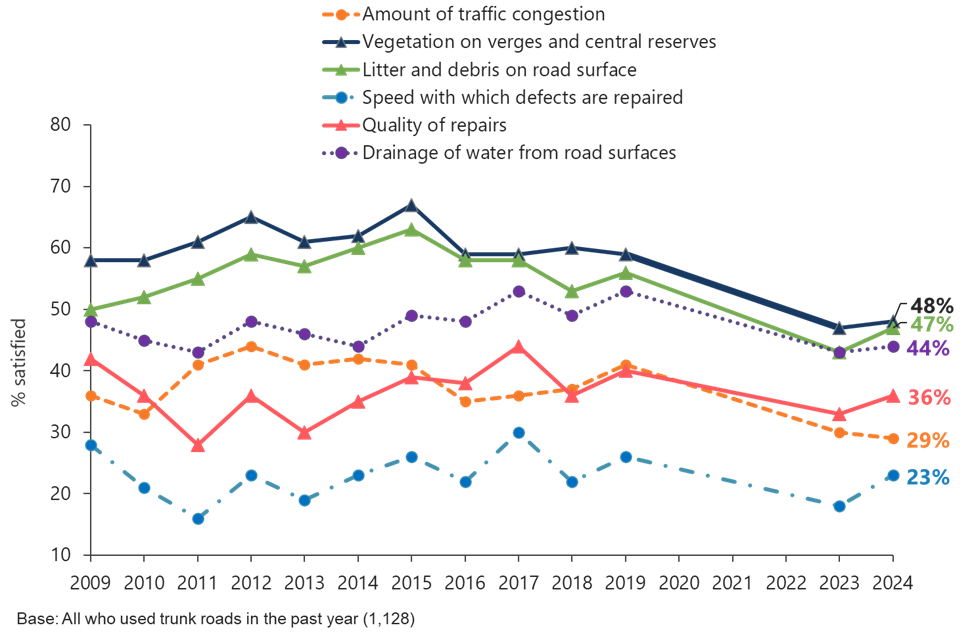
Among the other aspects of trunk road management and maintenance, satisfaction was highest with the management of vegetation on verges and central reserves (48%), and lowest with the speed with which road defects, such as potholes, are repaired (23%) (Figure 2.6).
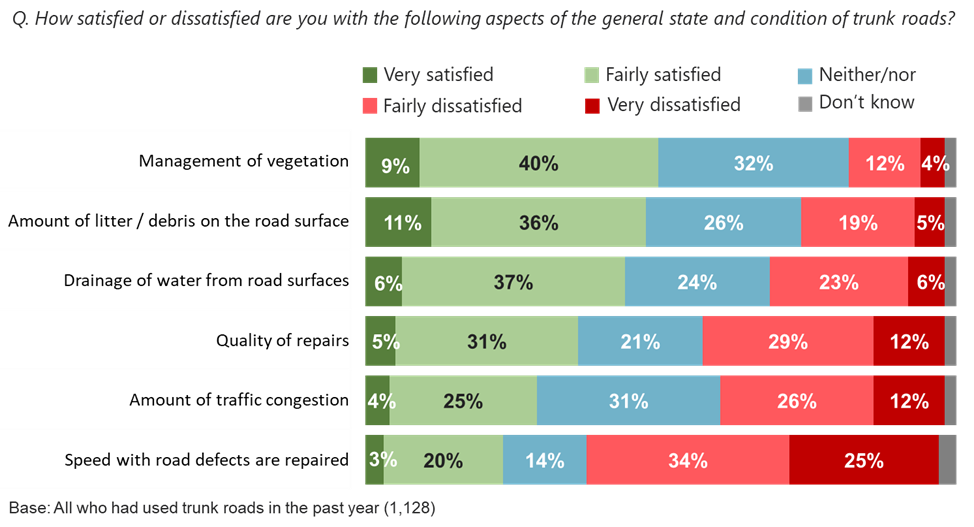
These findings were consistent with those from 2023 (Figure 2.7). Although the speed of repairs remained the lowest rated aspect, satisfaction with this increased between 2023 and 2024 (23%, compared to 18%).
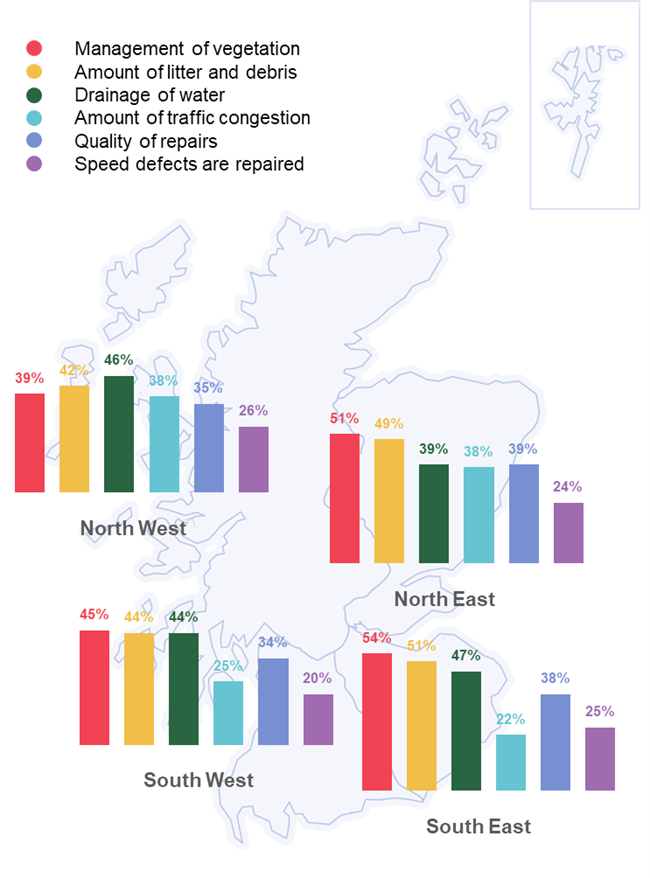
Respondents in the North West and North East were more likely than average to be satisfied with the amount of traffic congestion (both 38%, compared to 29%). Road users in the North West were less likely to be satisfied with the management of vegetation (39%, compared to 48%).
Perceived changes in the trunk road network
Respondents were presented with a list of aspects of service provision on the trunk road network and asked if they thought these had got better, worse or stayed the same over the past two years. Almost half felt there had been a worsening in the general condition of road surfaces (48%) and the frequency of roadworks (46%). For all other aspects of service provision, a majority (between 58% and 69%) felt that there had been no change.
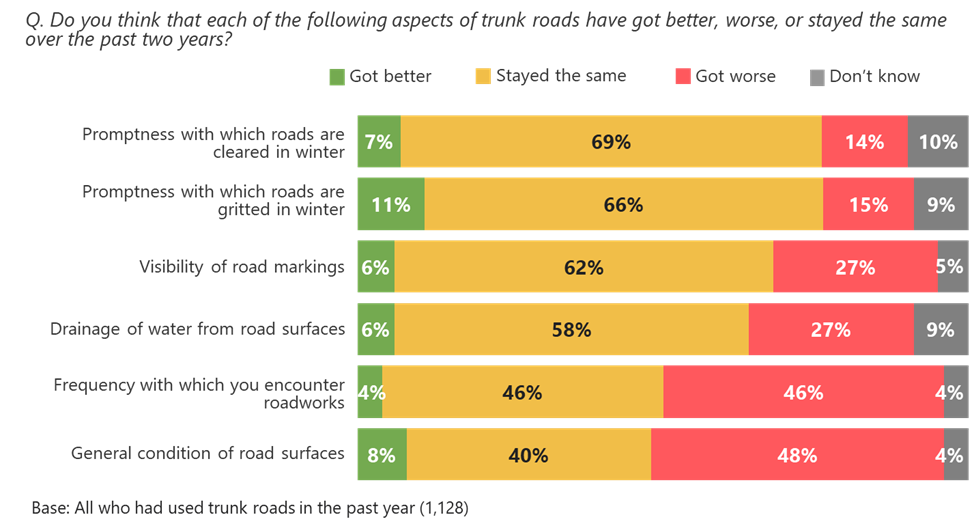
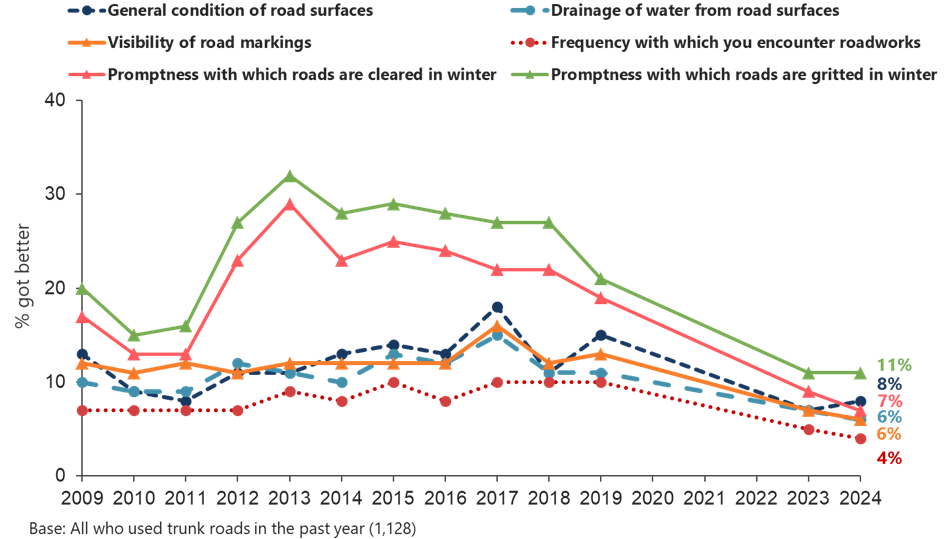
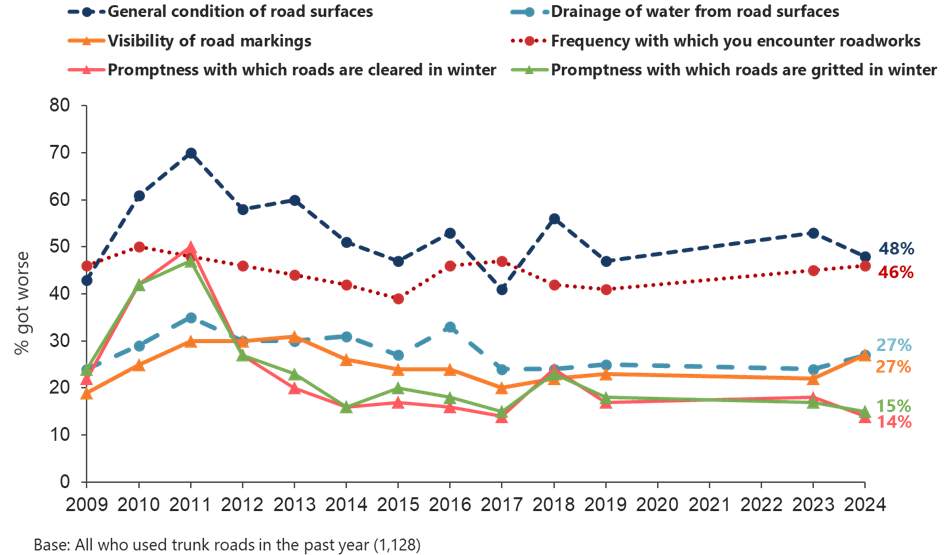
These findings were broadly in line with 2023 (Figures 2.10 and 2.11), although there was a slight increase in those who felt the visibility of road markings had got worse (27%, compared to 22%).
Respondents in the South West were more likely than average to say that the general condition of road surfaces (54%, compared to 48%) and the visibility of road markings (33%, compared to 27%) had got worse. Meanwhile, those in the North West were less likely than average to say that the frequency they encountered road works had got worse (33%, compared to 46%) and more likely to say that it stayed the same (57%, compared to 46%).
Older road users, aged 55 and over, were more likely than those under 55 to have perceived deteriorations across a number of aspects of the trunk road network, including the general condition of road surfaces (59%, compared to 41%), frequency of encountering roadworks (52%, compared to 41%), drainage of water and flooding (31%, compared to 23%),
Addressing trunk road defects
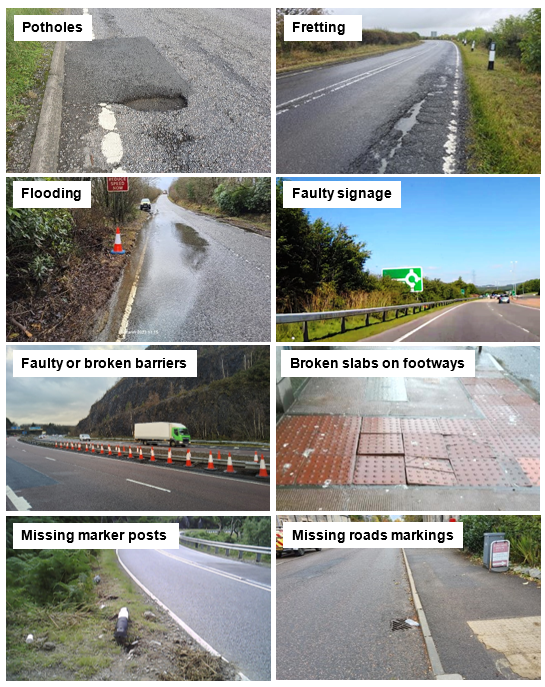
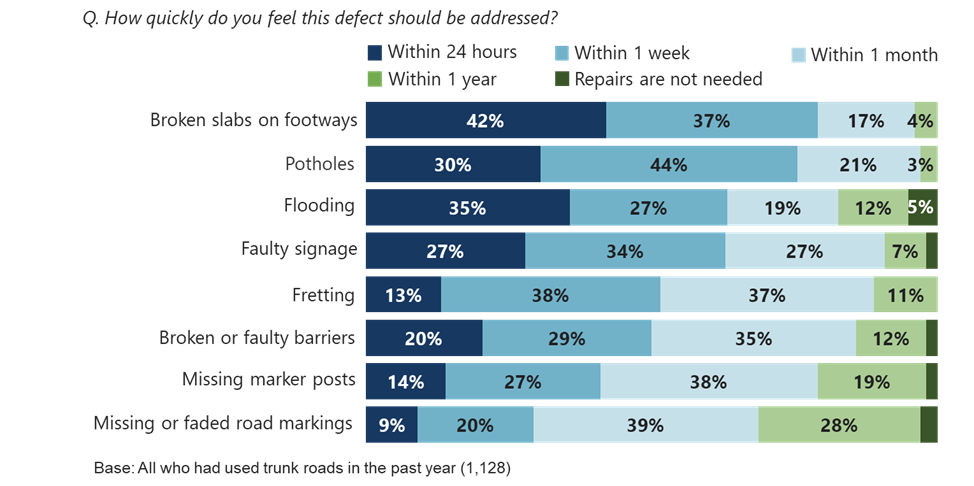
Respondents were shown images of eight types of road defect (Figure 2.12) and asked how quickly, if at all, they felt each one should be repaired. The images used for potholes, fretting, broken barriers, flooding and missing road markings were updated for the 2024 survey, and as a result, it is not possible to make direct comparisons between the 2023 and 2024 results for these defects.
Broken footway slabs were the most immediate priority for repair, with 78% saying this defect should be repaired within a week and 42% saying it should be repaired within 24 hours. A majority of respondents also indicated that potholes (74%), flooding (62%) and faulty signage (61%) should be repaired within a week. For all types of defect, the majority of respondents believed they should be repaired within a month (Figure 2.13).
Respondents in the North West were more likely than average to say that repairs to potholes should be made within 24 hours (38%, compared to 30%) and fretting (19%, compared to 13%), while those in the North East were more likely to say that flooding defects should be repaired within 24 hours (44%, compared to 35%) (Table 2.2).
In the case of missing or faded road markings, those in the North were more likely to say these should be repaired within 24 hours (11%, compared to 7% in the South).
| Defect | All | North West | North East | South West | South East |
|---|---|---|---|---|---|
| Broken slabs on footways | 42% | 47% | 40% | 45% | 37% |
| Potholes | 30% | 38% | 28% | 31% | 27% |
| Flooding | 35% | 28% | 44% | 33% | 32% |
| Faulty signage | 27% | 32% | 27% | 26% | 27% |
| Fretting | 13% | 19% | 11% | 13% | 12% |
| Broken or faulty barriers | 20% | 18% | 16% | 21% | 25% |
| Missing marker posts | 14% | 16% | 10% | 16% | 13% |
| Missing or faded road markings | 9% | 12% | 10% | 9% | 5% |
| Base: All who had used trunk roads at some point in the last year | 1,128 | 141 | 291 | 380 | 311 |