Options appraisal
The options appraisal looks to compare policy options without assigning monetary values to their impacts. This approach has been adopted as an alternative to cost-benefit analysis given the lack of information on monetary values at present.
Method
This Multi-Criteria Analysis (MCA) was based on the Policy Appraisal Framework (PAF) within the Scottish Transport Appraisal Guidance (STAG).
The baseline assumptions, to allow a clear comparison across different modes, are that there are no existing schemes in place for those under 26s, but that there were existing under 19s concessions as of January 2021. This enabled the analysis to inform the introduction of under 22s concessionary bus fares and free bike pilots.
Objective Setting
The key objectives of affordability, availability and accessibility of public transport services for young people were identified from the evidence and data gathered for the review. Any options proposed have been assessed against these key objectives.
Safety was another key concern highlighted throughout stakeholder engagement, both pre-pandemic, during the development of the NTS, and during COVID-19 (particularly pertinent given the public messaging regarding avoiding public transport). This third criteria was not a direct objective to assess against, but instead was discussed more widely within each of the appraisal sessions.
Assessment Criteria
Following on from the objective setting, and considering the problems and opportunities detailed above at a high level, the following section assesses a number of strategic, high level options making an initial assessment of the potential cost and impact across the NTS2 outcomes.
These options were assessed using Multi-Criteria analysis using the NTS2 priorities (and sub-criteria) as well as considering Efficiency & Alignment (cost of implementation and link to existing policies) and Technical & Implementation issues (legal, technical feasibility and public perception).
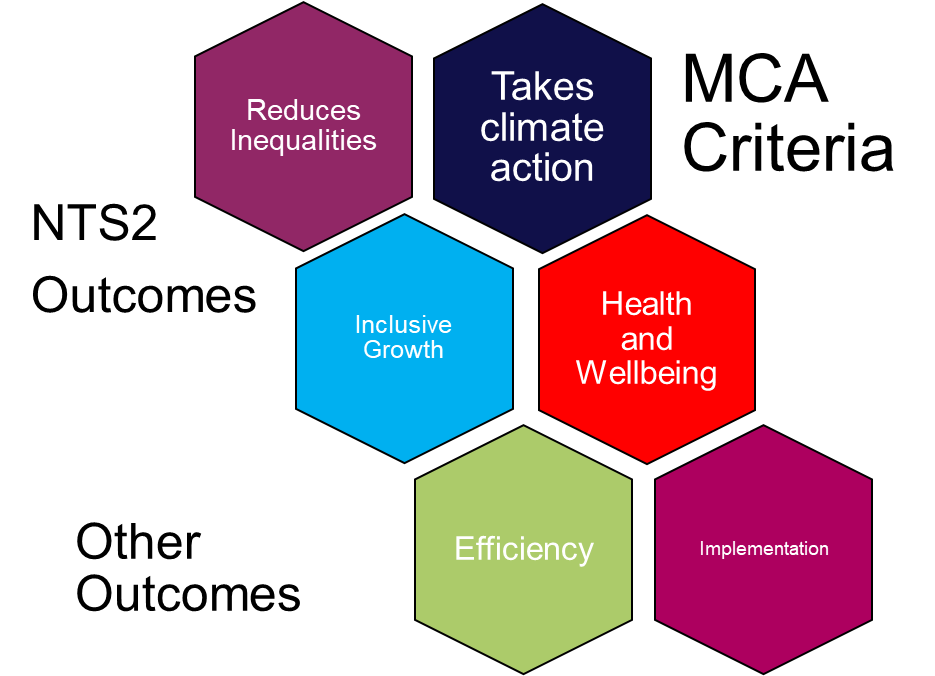
Reduces Inequalities
- Will provide fair access to services we need: we have a duty to reduce inequalities and advance equality of opportunity and outcome, including the protected characteristics of age, disability, gender reassignment, marriage and civil partnership, pregnancy and maternity, race, religion or belief, sex and sexual orientation. We will ensure that our disadvantaged communities and individuals have fair access to the transport services they need. The transport system will enable everyone to access a wide range of services and to realise their human rights. This is about the nature of those who benefit in terms of protected characteristics.
- Will be easy to use for all: people have different needs and capabilities. Our transport system will recognise these and work to ensure that everyone can use the system with as few barriers as possible. This includes affordability.
- Will be affordable for all: people have different incomes and our transport system will not exclude people from mobility by making it unaffordable. We will target actions to deliver the Strategy towards those needing most help, including those living in poverty. This about how well the intervention is targeted at those who need help.
Takes climate action
- Will help deliver our net-zero target: the Climate Change Act passed by the Scottish Parliament includes an increased ambition to reduce greenhouse gas emissions to 75% of 1990 levels by 2030, 90% by 2040 (i.e. the period covered by this National Transport Strategy) and net-zero emissions by 2045. Transport is currently the largest contributor to Scottish emissions and this will be tackled through a range of actions, including an ambition to phase out the need for new petrol and diesel cars and vans by 2032, changing people’s travel behaviour and managing demand.
- Will adapt to the effects of climate change: in Scotland we are already experiencing the impacts of climate change and we will adapt our transport system to remain resilient and reduce the harmful effects on future generations.
- Will enable greener, cleaner choices: over the next 20 years, Scotland will see a continued transformation in transport where sustainable travel options are people’s first choice if they need to travel. We will design our transport system so that walking, cycling and public and shared transport take precedence ahead of private car use.
Inclusive Growth
- Will get people and goods where they need to get to: network and services will be integrated effectively with spatial and land use planning and economic development, and adapt to changing requirements of our citizens, businesses and visitors.
- Will be reliable, efficient and high quality: everyone needs to be confident about how long a journey will take, and that it will be a simple and comfortable experience. We will be able to plan our lives, to get to work on time, access education and training, and to deliver goods efficiently and keep businesses running smoothly.
- Will use beneficial innovation: will pioneer and use new products, services and technologies developed from high quality research to improve our transport system. We will secure opportunities and investment for innovation and growth of testing platforms and supply chains to help Scotland be at the forefront of world leading developments in sustainable mobility.
Health and wellbeing
- Will be safe and secure for all: the prevention and reduction of incidents, on the transport system will continue to be a priority.
- Will enable us to make healthy travel choices: active modes will be a preferred method of travel and have a significant positive effect on individual health and wellbeing. This will reduce the social and economic impact of public health problems such as mental health, obesity, type-2 diabetes, and cardiovascular diseases.
- Will help make our communities great places to live: cleaner and greener places and networks will encourage walking, wheeling and cycling. This will deliver more social interaction, support local businesses and services and create vibrant communities.
In addition, two further criteria were assessed:
Efficiency and alignment
This category looks at likely resource cost (how much time, effort and cost (unquantified) the intervention will be to administer), the alignment to existing provision, and the alignment to the wider SG vision (Programme for Government, Economic Strategy). It also considers the potential impact on the wider SG public sector reform agenda and the strategic tie up with regulation and policy.
Implementation and risk
This category considers legal and technical feasibility or difficulty and the potential public perception of the interventions. It considers the likely time to implement and the risks to both implementation and continuing delivery.
Strategic Options
The strategic options which were used for appraisal were looked at by mode and by targeted group.
For modes, the options considered were:
- All modes (all of the options below)
- Non-active modes only – the bus, rail and ferry options
- Bus only – the extension of the U19s free bus scheme to U26s
- Rail only – the provision of free rail travel for U26s
- Ferry only – the provision of up to one weekly free return (foot passenger - we did not consider intra-island trips that could be used more frequently due to a lack of data but this option for all island residents is picked up within the all modes analysis) trips for U26 island residents
- Active modes only – the access to a cycle for all U26s through either the grant funding of an appropriate cycle / free cycle hire
With regards to people, the options considered looked at:
- All those U26 not already benefiting under the Do-Minimum
- Those U26 with income less than the top end of the basic tax rate (£25,158)
- Those U26 paying the starter rate of income tax or no income tax (income up to £14,585)
- Those U26 in receipt of any (UK Government or Scottish Government) social security benefit
- Those U26 receiving a SG benefit (See Annex A)
- Young parents – those U26 (either parent) with children under 16
The results that follow below are presented as matrices that show the impact across both modes and people.
The do-minimum, or baseline
The do-minimum (or baseline) for the purposes of this appraisal was taken to be the introduction of the under 19s free bus scheme in addition to current schemes (as discussed above). None of the options specifically deal with availability of services. For each option it is assumed that existing services expand as required to meet demand but no new services are introduced. As such availability of services was considered exogenously to the appraisal and is a crucial factor in interpreting the results.
SG Social Security Benefits
For the purposes of this exercise an SG social security benefit was defined as: benefits relating to ill health or disability even if not yet transferred to Scotland and specific benefits relating to low income or circumstances. For example:
- Best Start Grant Pregnancy and Baby Payment – one off payment of up to £600 from 24 weeks in pregnancy up until a baby turns 6 months for families who get certain benefits.
- Best Start Grant Early Learning Payment – one off payment of £250 when a child is between two and three years and six months for families who get certain benefits.
- Best Start Grant School Age Payment – one off payment of £250 when a child would normally start primary one for families who get certain benefits.
- Best Start Foods – a pre-paid card from pregnancy up to when a child turns three for families on certain benefits to help buy healthy food.
- Carer’s Allowance Supplement – an automatic payment made twice a year to people who get Carer’s Allowance through the DWP on certain dates each year.
- Funeral Support Payment – money towards the costs of a funeral at a difficult time like this for people on certain benefits who are responsible for paying for a funeral.
- Job Start Payment – £250 for 16 to 24 year olds who have been on certain benefits for six months or more to help with the costs of starting a job.
- Young Carer Grant – an annual payment of more than £300 for people 16, 17 or 18 who care for people who get a disability benefit from the DWP for an average of 16 hours a week or more.
- Scottish Child Payment - new benefit will give eligible families on low incomes with children under 6 an extra £10 per week for each child. It is planned to be fully rolled out to children under the age of 16 by the end of 2022.
For further detail see Appendix C.
The table below provides an overview of the indicative costing of the options. All options are currently unbudgeted. Any policy interventions would require additional budget to be taken forward at a time when there are significant pressures on budgets and exacerbated financial constraints. The cost of any additional free public transport concessions has to be considered alongside the alternative use of the funds, the availability of services and the costs of keeping a viable network operating. A key point is that a concession is of no value if there are no and/or very limited public transport services to access.
People column key for following tables:
- Group A - All U26
- Group B - Those U26 with income less than the top end of the basic tax rate (£25,158)
- Group C - Those U26 paying the starter rate of income tax or no income tax (income up to £14,585)
- Group D - Those U26 in receipt of any (UKG or SG) social security benefit
- Group E - Those U26 receiving a SG benefit
- Group F - Young parents – Those U26 (either parent) with children under 16
Table 2: indicative costings of options for concessionary fares across all modes
| People | All modes | Non-active | Bus | Rail | Ferry | Active |
|---|---|---|---|---|---|---|
| Group A | 330 | 300 | 140 | 140 | 30 | 30 |
| Group B | 290 | 260 | 120 | 120 | 20 | 30 |
| Group C | 160 | 150 | 70 | 70 | 14 | 15 |
| Group D | 40 | 40 | 17 | 17 | 4 | 4 |
| Group E | 10 | 9 | 4 | 4 | 1 | 1 |
| Group F | 12 | 11 | 5 | 5 | 1 | 1 |
By way of explanation the table shows across the columns the variation in estimated costs as the choice of modes is changed and down the rows the impact of restricting the people benefiting from the scheme. For example, the estimated costs of a scheme that is for ferries only and only for those U26 paying the starter rate or no income tax is £14m.
The table below details the options and appraisal of benefits and costs. A higher number represents a more positive score and a lower number represents one that is more negative.
Considering the performance of the options in terms of “benefits” only (the 4 NTS outcomes), the best performing options from the appraisal were the offering of free public transport across all modes to young parents . The next highest were fare-free public transport for all modes, to all those under 26, and bus only for all under 26. The options around extending to those on SG benefits also performed well (benefits relating to ill health or disability even if not yet transferred to Scotland and specific benefits relating to low income or circumstances) although less so for rail only.
Table 3: Options and appraisal of benefits and costs. A higher number represents a more positive score and a lower number represents one that is more negative
| People | All modes | Non active | Bus | Rail | Ferry | Active |
|---|---|---|---|---|---|---|
| Group A | 31 | 18 | 29 | 1 | 10 | 12 |
| Group B | 34 | 21 | 32 | 3 | 13 | 16 |
| Group C | 33 | 20 | 31 | 2 | 11 | 15 |
| Group D | 23 | 10 | 21 | -7 | 2 | 5 |
| Group E | 23 | 11 | 22 | -7 | 2 | 6 |
| Group F | 30 | 17 | 26 | -1 | 8 | 11 |
For example, the score for a scheme that is for ferries only and only for those U26 paying the starter rate or no income tax is 11.
However when taking into account the non-NTS criteria around efficiency and implementation, the position worsens. This is particularly the case for the option that requires certification of UKG security benefits as this presents significant technical issues.
Table 4: Options and appraisal of benefits and costs taking into account the non-NTS criteria around efficiency and implementation. A higher number represents a more positive score and a lower number represents one that is more negative
| People | All modes | Non active | Bus | Rail | Ferry | Active |
|---|---|---|---|---|---|---|
| Group A | 28 | 10 | 30 | -27 | 15 | 18 |
| Group B | 2 | -26 | 0 | -63 | -20 | -17 |
| Group C | 3 | -25 | 0 | -62 | -19 | -14 |
| Group D | -39 | -63 | -41 | -100 | -58 | -53 |
| Group E | 22 | 4 | 25 | -33 | 10 | 15 |
| Group F | 57 | 39 | 57 | 3 | 45 | 49 |
For example, the score for a scheme that is for ferries only and only for those U26 paying the starter rate or no income tax is -19.
However, when taking into consideration costs, the numbers benefiting under each option and giving due consideration to deliverability to reflect some of the technical, legal and practical issues, the heatmap changes considerably (Annex B shows how the maps change with each addition).
Table 5: Options and appraisal of benefits and costs taking into account the non-NTS criteria around efficiency and implementation, and costs. A lower number represents one that is more negative.
| People | All modes | Non active | Bus | Rail | Ferry | Active |
|---|---|---|---|---|---|---|
| Group A | -88 | -93 | -24 | -73 | 1 | 2 |
| Group B | -87 | -100 | -42 | -88 | -28 | -26 |
| Group C | -28 | -37 | -14 | -39 | -12 | -10 |
| Group D | -8 | -10 | -7 | -13 | -8 | -7 |
| Group E | 0 | 0 | 1 | -1 | 0 | 0 |
| Group F | 2 | 1 | 2 | 0 | 1 | 2 |
< Previous | Contents | Next >