Annex A: Scotland's connectivity Pre-COVID
Annex A: Scotland's connectivity Pre-COVID
We have produced an We have produced an interactive map on Scotland’s air connectivity pre-COVID.
This allows you to filter per airport and region.
Europe 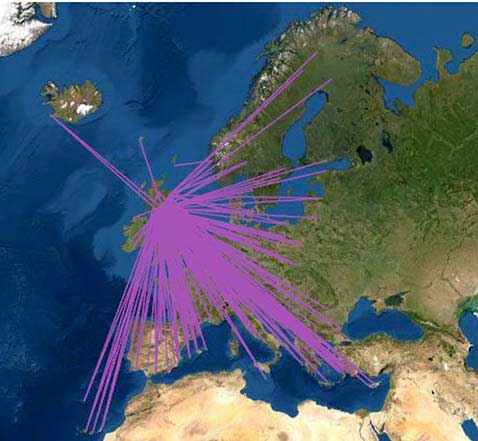 North and Central America
 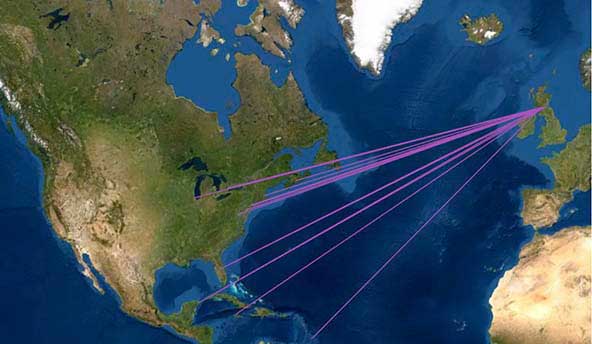 Rest of the World
 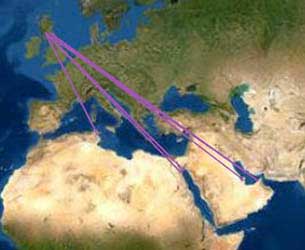 UK
UK 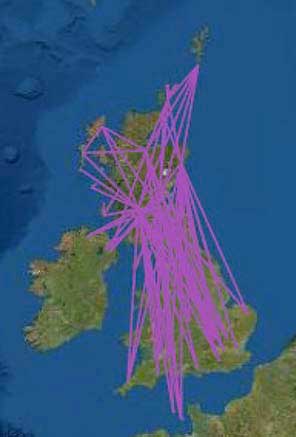
Scotland compared to peer regions
Scotland's air network has been benchmarked against UK and European peer regions and countries that share similar characteristics in terms of the economy, population, geographic position, size and level of air services.[10]
In 2008 Scotland was ranked 10th out of the 12 peer regions for short haul destinations and joint 6th for long haul. In 2019 Scotland was ranked 8th out of the 12 peer regions for short haul, with the largest percentage increase overall. However, the number of unique long haul destinations from Scotland did not increase as much as for peers such as Catalonia, as shown in the table below:
|
|
Unique Cities (short haul S08) |
Unique Cities (short haul S19) |
Unique Cities (long haul S08) |
Unique Cities (long haul S19) |
% change in number of cities |
Additional Cities (Long Haul) |
Additional Cities (Short Haul) |
Additional Cities (World Cities) |
Additional Cities (World Cities Long Haul) |
Additional Cities (World Cities Short Haul) |
|---|---|---|---|---|---|---|---|---|---|---|
|
Austria |
106 |
110 |
21 |
22 |
+3.9% |
1 |
4 |
7 |
3 |
4 |
|
Berlin/ Brandenburg (DE) |
71 |
103 |
3 |
7 |
+48.6% |
4 |
32 |
10 |
4 |
6 |
|
Cataluna (ES) |
101 |
100 |
4 |
27 |
+21.0% |
23 |
(1) |
21 |
21 |
- |
|
Denmark |
84 |
94 |
10 |
20 |
+21.3% |
10 |
10 |
13 |
10 |
3 |
|
Finland |
46 |
62 |
12 |
21 |
+43.1% |
9 |
16 |
11 |
8 |
3 |
|
Ireland |
103 |
108 |
11 |
22 |
+14.0% |
11 |
5 |
12 |
8 |
4 |
|
Midlands (UK) |
66 |
77 |
6 |
4 |
+12.5% |
(2) |
11 |
- |
- |
- |
|
North West (UK) |
88 |
111 |
15 |
22 |
+29.1% |
7 |
23 |
6 |
4 |
2 |
|
Norway
|
65 |
72 |
1 |
5 |
+16.7% |
4 |
7 |
3 |
4 |
(1) |
|
PACA (FR)
|
61 |
73 |
3 |
6 |
+23.4% |
3 |
12 |
7 |
3 |
4 |
|
Scotland |
51 |
79 |
6 |
10 |
+56.1% |
4 |
28 |
13 |
3 |
10 |
|
Veneto (IT) |
45 |
66 |
4 |
10 |
+55.1% |
6 |
21 |
17 |
6 |
11 |
- Unique international destination cities
- Summer 2019 vs Summer 2008
- Excludes cities with fewer than 80 departures per season
Peer Regions Summary (source: Altitude Analysis, OAG, GaWC)