Climate
Introduction
This chapter describes the assessment of climate related impacts of the A75 Springholm and Crocketford Improvements (hereafter referred to as “the proposed scheme”). The assessment has been undertaken with reference to the Design Manual for Roads and Bridges (DMBR) LA 114 - Climate (revision 0.01) (hereafter referred to as “DMRB LA 114”) and other relevant guidance set out in this chapter.
Legislative and Policy Framework
This section provides a summary of the legislation and policy relevant to this climate assessment.
Legislation
The following legislation is relevant to this climate assessment.
Paris Agreement (United Nations Framework Convention on Climate Change, 2016)
The central aim of the Paris Agreement is to strengthen the global response to the threat of climate change by keeping the rise in average global temperature this century well below 2 degrees Celsius above pre-industrial levels, and to pursue efforts to limit the temperature increase even further to 1.5 degrees Celsius. The UK was one of the 160 countries who signed the agreement. The UK’s response to meeting its commitments under the Paris Agreement resulted in the UK Climate Change Act 2008.
UK Climate Change Act 2008
This Act commits the UK to reducing carbon emissions to net zero by 2050. 'Net zero' means that the UK carbon account for the year 2050 is at least 100% lower than the net UK emissions of Greenhouse Gases (GHGs) for the 1990 baseline. The Climate Change Act 2008 also requires the Secretary of State (SoS) to set legally binding carbon budgets over five-year periods and to ensure that net UK carbon emissions do not exceed these budgets.
Carbon Budget Order 2011, Carbon Budget Order 2016 and The Carbon Budget Order 2021
The UK Government carbon budgets which have been set to-date and that are relevant to the improvement strategies are as follows:
- The fourth carbon budget: 2023 – 2027 defined within The Carbon Budget Order 2011 – 1,950 million tonnes carbon dioxide equivalent (MtCO 2 e), equivalent to a 50% reduction in annual emissions from a 1990 baseline.
- The fifth carbon budget: 2028 – 2032 defined within The Carbon Budget Order 2016 – 1,725MtCO 2 e, equivalent to a 57% reduction in annual emissions from a 1990 baseline.
- The sixth carbon budget: 2033 – 2037 defined within The Carbon Budget Order 2021 – 965MtCO 2 e, equivalent to a 78% reduction in annual emissions from a 1990 baseline. It is the first budget which is in line with the 2050 net zero carbon target.
In February 2025, the Climate Change Committee (CCC) advised the UK Government to set the 7th Carbon Budget at 535 MtCO 2 e for the period 2038-2042, aiming for an 87% reduction in emissions compared to 1990 levels by 2040. This had not been adopted at the time of writing.
The Climate Change (Scotland) Act 2009
The Climate Change (Scotland) Act 2009 established a framework for Scotland to achieve its long-term goals of reducing GHG emissions by at least 80% by 2050. An interim target of a 42% reduction by 2020 was also set.
The Climate Change (Emissions Reduction Targets) (Scotland) Act 2019
Amends the target to ‘net-zero emissions target’ for all GHG emissions by 2045. It also amends the interim targets to become 56% by 2020, 75% by 2030 and 90% by 2040.
The UK Government carbon budgets use carbon dioxide equivalent (CO 2 e) to represent the emissions of the seven GHGs included in the Kyoto Protocol (carbon dioxide, methane, nitrous oxide, hydrofluorocarbons, perfluorocarbons, sulphur).
In March 2024, the Climate Change Committee (CCC) concluded that it was unlikely that the Scottish Government would meet its statutory 2030 goal to reduce emissions by 75%. This conclusion was accepted by the Scottish Government. In response, the Scottish Government intends to bring forward expedited legislation to introduce a target approach based on five-yearly carbon budgets, whilst retaining the 2045 net zero target. Until such time as these carbon budgets are defined and legislated, and for the purposes of this assessment, it is assumed that the interim targets, under The Climate Change (Emissions Reduction Targets) (Scotland) Act 2019, in the above sub-sections are still applicable.
National Policy
In the context of the Climate Change (Scotland) Act 2009, Scottish Ministers are obliged to lay a report in Parliament setting out their proposals and policies for meeting annual emissions reduction targets. This Climate Change Plan is the Scottish Government’s third Report on Proposals and Policies (RPP3) for meeting climate change targets for the period 2018–2032. In RPP3, special reference is made to Transport Scotland and the related policies and plans.
In December 2020, the Scottish Government released the Securing a green recovery on a path to net zero: climate change plan 2018–2032 - update (hereafter referred to as the “CCP update”), which recognised the enormous challenges caused by the COVID-19 pandemic and the effect these could have on the ability of the Scottish Government to meet its greenhouse gas (GHG) emissions reduction targets. The update makes clear, however, that the Scottish Government remains absolutely committed to ending Scotland’s contribution to climate change, despite these challenges. As such, it aims for a ‘green recovery’ that captures opportunities to transition towards ‘net zero’ through the creation of green jobs, by developing sustainability skills, improving wellbeing and addressing inequalities.
The CCP update includes commitments to reduce car kilometres by 20% by 2030, to phase out the ‘need’ for new petrol and diesel cars and vans by 2030 and new petrol and light commercial vehicles within the public sector fleet by 2025. Such activities are likely to result in a substantial reduction in Scottish road traffic related GHG emissions over time. The climate targets are under periodic review and therefore may be subject to change.
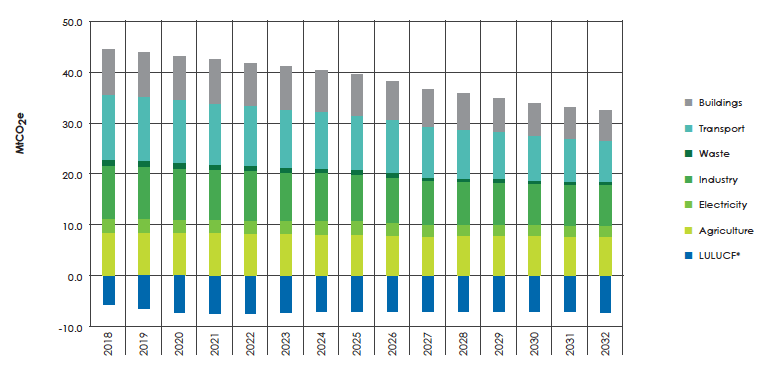
The CCP update presents proposals and policies to meet Scotland’s annual emissions reduction targets to 2032. This is done through a sectoral approach, and each sector has an ‘emissions envelope’. The seven sectors for which ‘emissions envelopes' have been estimated are: electricity; buildings; transport; industry; waste; land use, land use change and forestry (LULUCF); and agriculture (as illustrated in Figure 14-1 below). Figure 14.1 depicts the different emission envelopes over time from 2018 to 2032 as a bar chart: agriculture and LULUCP remain broadly the same; with the remaining emission envelopes reducing over time.
The Climate Ready Scotland: climate change adaptation programme 2019-2024 (hereafter referred to as “SCCAP”) is the second Scottish Climate Change Adaptation Programme which sets out policies and proposals to prepare Scotland for the challenges that will be faced as climate continues to change in the decades ahead. The SCCAP is a requirement of the Climate Change (Scotland) Act 2009 and addresses the risks set out in the UK’s second UK Climate Change Risk Assessment 2017 published under Section 56 of the UK Climate Change Act 2008. A Climate change: Scottish National Adaptation Plan 2024-2029 has since been produced in response to UK Climate Change Risk Assessment 2022 , which includes policy proposals for adaptation and resilience to be embedded across trunk road transport networks, supported by the Transport Scotland adaptation strategy as set out in Transport Scotland’s Approach to Climate Change Adaptation and Resilience .
The National Planning Framework 4 (hereafter referred to as “NPF4”) was published in February 2023 and provides a spatial planning response to the global climate emergency up to 2050. As per the NPF4 document, the proposed key objective of NPF4 is to ensure planning policy results in spatial and land use change that facilitates Scotland’s ambition to have ‘net-zero’ emissions by 2045 and meet other statutory emissions reduction targets, whilst also supporting communities and businesses in making the necessary changes to meet the targets. One of the main issues to be considered is the policy criteria needed to ensure that new development, including transport and infrastructure, contribute as far as possible to meeting emission reduction targets.
NPF4 includes key policies focused on climate. Policy 1 Tackling the climate and nature crisis states:
- ‘When considering all development proposals significant weight will be given to the global climate and nature crises’.
Policy 2 Climate mitigation and adaptation states:
- ‘Development proposals will be sited and designed to minimise lifecycle greenhouse gas emissions as far as possible
- Development proposals will be sited and designed to adapt to current and future risks from climate change
- Development proposals to retrofit measures to existing developments that reduce emissions or support adaptation to climate change will be supported’.
In February 2020, the Scottish Government released The Environment Strategy for Scotland: vision and outcomes . In the strategy it is stated that:
- ‘By 2045: By restoring nature and ending Scotland’s contribution to climate change, our country is transformed for the better - helping to secure the wellbeing of our people and planet for generations to come’.
Transport Scotland Policy
The Road Asset Management Plan for Scottish Trunk Roads identifies environmental sustainability as one of its main objectives and specifically commits ‘…to protect the environment by minimising carbon emissions and promote the use of sustainable materials used on road maintenance work’. Furthermore, it identifies weather related disruption due to climate change as one of the major risks in network management.
Transport Scotland’s Approach to Climate Change Adaptation and Resilience outlines the key climate risks affecting Scotland’s transport system and sets out a Strategic Outcome for ‘Trunk Roads which are well adapted and resilient to the current, projected and unexpected impacts of climate change’.
Local Policy and Plans
Dumfries and Galloway Council, like many other local authorities, declared a climate emergency in 2019. As part of their climate response, they have developed their Route map for Carbon Neutral in Dumfries and Galloway 2021 to 2026 and more recently emission reduction targets outlined in Climate emergency .
The Dumfries and Galloway Council organisational emissions targets are:
- Make a 75% reduction in carbon emissions by 2027 (from 2008/09 baseline) – already achieved 63% reduction by 2022/23.
- Make a 90% reduction in carbon emissions by 2031.
- Become a carbon neutral organisation by 2033.
The Dumfries and Galloway Council regional emissions targets are:
- Become a net zero region on or before 2040.
- Transition to a carbon negative region by 2045 to align with the wider aspiration outlined by South of Scotland Enterprise.
Assessment Methodology
Methodology
DMRB LA 114 sets out the requirements for assessing and reporting the potential effects of climate on highway projects (i.e. climate change resilience and adaptation), and the potential effect on climate of GHG emissions from construction, operation and maintenance of highway projects. The methodology for this environmental assessment aligns with DMRB LA 114.
Within DMRB LA 114, Table 3.11.1 outlines the different GHG emission sources and lifecycle stages of a project and suggests activity data that could be used to inform GHG emissions estimates. Details of the methodology adopted within this assessment for the different lifecycle stages described in Table 3.11.1 of DMRB LA 114 are set out in the sub-sections below.
Typically, at DMRB Stage 1, where detailed design information is not available, either benchmarks (derived from the results of other projects) or a more simplified approach is followed to estimate GHG emissions, whilst some, less sizeable, emission sources are not considered at all. This is in line with the proportionate approach detailed in paragraph 3.7 of DMRB LA 114 which states:
- ‘Where there is insufficient, reliable information for quantitative assessment for any life cycle stage of the project, a qualitative assessment of GHG emissions shall be completed in the early stages of project development’.
In addition, paragraph 3.14 of DMRB LA 114 also states:
- ‘A proportionate approach shall be applied to capture the principal contributing factors associated with GHG emissions’.
GHG Emissions Estimation Methodology - Construction
The sub-sections below consider all the construction-related lifecycle sub-stages as listed in Table 3.11.1 of DMRB LA 114 and the associated methodology used within this assessment or alternatively whether a particular life cycle stage or emission generating activity has not been considered at this stage due to the lack of available data.
At this stage, the assessment comprises a high-level qualitative assessment of potential construction stage emissions applicable to all improvement strategies, given that neither design information nor traffic data are available.
Sub-Stage of the Life Cycle: Product Stage
Product stage including raw material supply, transport and manufacture (for example embodied GHG emissions associated with the required raw materials for construction).
Methodology
A qualitative assessment methodology was used for each improvement strategy based on the length of each improvement strategy, if there are any major river crossings (such as Urr Water) and the number of new major structures associated with the improvement strategy.
Sub-Stage of the Life Cycle: Construction Process Stage
Construction process stage; including transport to/from works site and construction/installation processes.
Methodology
A qualitative assessment methodology was used for each improvement strategy based on the length of each improvement strategy, if there are any major river crossings (such as Urr Water) and the number of new major structures associated with the improvement strategy.
Sub-Stage of the Life Cycle: Land Use Change
Land use change (for example GHG emissions mobilised from vegetation and soil loss/disturbance).
Methodology
Not calculated at DMRB Stage 1 due to a simple improvement strategy approach being adopted.
GHG Emissions Estimation Methodology – Operation (‘use-stage’) (to extend 60 years in line with appraisal period)
The sub-sections below consider all the operation-related lifecycle sub-stages as listed in Table 3.11.1 of DMRB LA 114 and the associated methodology used within this assessment or alternatively whether a particular life cycle stage or emission generating activity has not been considered at this stage due to the lack of available data.
Sub-Stage of the Life Cycle: Operation and Maintenance
Operation and maintenance (including repair, replacement and refurbishment) (for example GHG emissions associated with infrastructure operation and activities of organisations conducting routine maintenance, including required raw materials for maintenance and replacement of the proposed scheme components).
Methodology
Not calculated at DMRB Stage 1 due to a simple improvement strategy approach being adopted. The magnitude of such emissions are, however, likely to be proportionate to construction stage emissions.
Sub-Stage of the Life Cycle: GHG emissions from vehicles
GHG emissions from vehicles using the highways infrastructure.
Methodology
Not calculated at DMRB Stage 1 due to a simple improvement strategy approach being adopted and no road traffic data being available.
Sub-Stage of the Life Cycle: Ongoing Land use GHG
Ongoing land use GHG emissions/sequestration each year (for example changes in soil carbon resulting from a change in land use).
Methodology
Not calculated at DMRB Stage 1 due to a simple improvement strategy approach being adopted.
Vulnerability of the Improvement Strategies to Climate Change
Current climate conditions have been identified within the study area for the six improvement strategies and future climate projections analysed in order to assess potential changes in climate over the lifespan of the proposed scheme of 60 years. For this purpose, the 25km UK Climate Projections 2018 (UKCP18) from the UK Climate Projections probabilistic projections datasets were used under the high emissions scenario. Specifically, the Representative Concentration Pathway 8.5 (RCP8.5) dataset was used, for the 50% probability level. This dataset is likely to provide a more conservative estimate of future climate change, as it represents the highest modelled GHG emissions scenario and typically provides the broadest ranges of uncertainty in future changes for key UK climate variables and global average temperature.
More detailed information was also obtained from the UKCP18 12km dataset. This regional scale provides coverage over the UK in higher spatial and temporal detail, giving an improved representation of daily metrics and extremes.
Following the determination of potential climate trends in future years, likely proposed scheme-related receptors with the potential to be affected by climate impacts have been identified based on the available designs.
Indications of past vulnerability were identified in relation to historical weather events to understand if there are any particular constraints for any of the improvement strategies, for example heavy rainfall and historical flooding (refer to the Road Drainage and the Water Environment Chapter of this EAR).
At this stage, the proposed scheme design is not sufficiently detailed to undertake a specific vulnerability assessment of the improvement strategies. Therefore, a high-level, qualitative consideration of proposed scheme-related receptors, the key climate variables and potential impacts was undertaken to a similar level of detail to that in Table 3.35N of DMRB LA 114. This level of detail is deemed appropriate for informing the vulnerability assessment at this stage and, together with the information on past vulnerability, was used to identify the following:
- If there are any key risks which need to be addressed at later stages of the design.
- Notable differences in the improvement strategies which could have a bearing on the vulnerability of a particular design option, the required level of essential mitigation, or potential significance of effect.
Data Sources
Baseline data were collected from a variety of sources in compiling this assessment. These are outlined in the list below:
- Scottish Greenhouse Gas Statistics 2022
- UK local authority and regional greenhouse gas emissions statistics, 2005 to 2022
- UKCP18 baseline and climate projections for 25km spatial resolution dataset for the grid square centred on Easting 287500, Northing 562500and 12km spatial resolution dataset for the grid square centred on Easting 282000, Northing 570000 sourced from UK Climate Projections
Assumptions and Limitations
A high-level improvement strategy qualitative assessment has been undertaken due to the limited available information at this DMRB Stage 1, refer to the Limitations section of this chapter. Any conclusions should therefore take this into consideration.
Assumptions
No design details other than broad indicative improvement strategies were available at this stage. As suitable data were not available, it was not possible to estimate construction related emissions and therefore a qualitative assessment was undertaken for the construction stage.
The approach used is, however, considered proportionate to a DMRB Stage 1 improvement strategy level assessment, and has allowed each improvement strategy to be compared on a like for like basis and allow for differentiation between each design option in terms of potential construction related emissions (which is likely to be a key source of the proposed scheme-related GHG emissions).
Due to the uncertainty in the exact location of where land take will be required within the improvement strategies, for land use change related GHG emissions, it is assumed that these emissions would be proportional to the overall lengths of road construction (as explained in the Potential Impacts section of this chapter) of the improvement strategies, as discussed in the GHG Emissions Estimation Methodology – Construction and Operations sections of this chapter.
Limitations
Traffic data was not available at DMRB Stage 1 and therefore an assessment of road traffic emissions could not be undertaken.
The assessment of vulnerability to climate change was based on a high-level consideration of key asset receptors and was designed to identify any improvement strategies which may be more vulnerable or require specific consideration through design or management.
Paragraph 3.30 of DMRB LA 114 states that assessments should use the “H++ climate scenarios” (a series of low probability, high impact climate projection scenarios) to test the sensitivity of vulnerable safety critical features (for example structures). If such vulnerable safety critical features are included within the proposed scheme, the H++ data would be used at DMRB Stage 3 to test the sensitivity of these features when more detailed design data are available.
In-combination climate change impacts and impacts on receptors within the surrounding environment as a result of the combined impact of the proposed scheme and climate change would be considered at DMRB Stage 2 and 3 when more detailed design data is available to support the assessment. An additional assessment of the combined effects of climate change related impacts on other strategic transport infrastructure beyond the boundary of the proposed scheme would also be undertaken at DMRB Stage 3.
Study Area
The study area for GHG emissions is defined by the emissions regardless of where they occur, rather than a geographical area (see paragraph 3.8 of DMRB LA 114). However, in the absence of any calculated emissions due to the early stage of the proposed scheme, a 2km buffer of the outer limit of the improvement strategies has been used as a general study area for all elements of this climate change assessment. The study area is located within the administrative boundary of Dumfries and Galloway Council.
The potential vulnerability of the proposed scheme to climate change impacts is based on the UK current and future climate projections for the 25km and 12km nearest grid squares covering the study area, as shown in Figure 14-2 (refer to further explanation in the Vulnerability of the Proposed Scheme to Climate Change section of this chapter).
Baseline Conditions
National Emissions
At a national level, the latest Scottish Greenhouse Gas Statistics 2022 indicates that GHG emissions in 2022 were down by 50.1% (between the 1990 baseline and 2022), compared to The Climate Change (Emissions Reduction Targets) (Scotland) Act 2019 specified target of a 53.8% reduction over the same period. Therefore, the interim target for 2022 has not been met.
Between 1990 and 2022, domestic transport emissions in Scotland are estimated to have decreased by 15.0%, however, such emissions were the largest source of net emissions in Scotland in 2022 (contributing 28.3%).
Dumfries and Galloway Emissions
The proposed scheme is located within the administrative boundary of Dumfries and Galloway Council. Estimated GHG emissions associated with activities within the Dumfries and Galloway Council administrative area obtained from the most recent UK National Atmospheric Emissions Inventory (NAEI) dataset for local authorities (published on UK local authority and regional greenhouse gas emissions statistics, 2005 to 2022 ), are presented in Table 14-1 and Table 14-2 and compared with relevant emission totals for Scotland as a whole.
The total net council-wide GHG emissions in 2022 are estimated to have been 2,303 kilotonnes of carbon dioxide equivalent (kt CO 2 e), which accounts for approximately 5.9% of total net GHG emissions in Scotland (i.e. 38,857kt CO 2 e).
Road transport related GHG emissions in the Dumfries and Galloway Council area (i.e. 520kt CO 2 e) are estimated to have accounted for 21.2% of total PKC area emissions (excluding LULUCF net emissions, which are negative) and 5.4% of total road transport related GHG emissions in Scotland. ‘A’ roads, including the A75, are estimated to have contributed 8.6% of total GHG emissions for the Dumfries and Galloway Council area (excluding LULUCF net emissions) and 2.2% of total road transport related GHG emissions in Scotland.
| Sector | GHG Emissions (kT CO 2 e) |
|---|---|
|
Industry total |
121.1 |
|
Commercial total |
84.0 |
|
Public Sector total |
19.6 |
|
Domestic total |
229.9 |
|
Road transport (A roads) |
210.6 |
|
Road transport (Motorways) |
231.0 |
|
Road transport (Minor roads) |
78.5 |
|
Diesel railways |
5.4 |
|
Transport other |
5.4 |
|
Agriculture total |
1,452.3 |
|
Waste total |
15.3 |
|
LULUCF Net emissions |
-150.2 |
|
Total net emissions |
2,302.9 |
| Sector | Percentage of GHG Emissions (%) |
|---|---|
|
Area road transport GHG emissions as proportion of total area GHG emissions (excluding LULUCF Net Emissions) |
21.2% |
|
Area road transport GHG emissions as proportion of total Scotland road transport GHG emissions |
5.4% |
|
Area A roads GHG emissions as a proportion of total area GHG emissions (excluding LULUCF Net Emissions) |
8.6% |
|
Area A roads GHG emissions as a proportion of total Scotland road transport GHG emissions |
2.2% |
Vulnerability of the Proposed Scheme to Climate Change
The Met Office has produced the HadUK-Grid Gridded Climate Observations which are observed values for climate variables at a 25km resolution, derived from 1km resolution data, and covering the period 1836-2023. From this dataset, values representing the baseline period 1981 – 2010 and for the 25km grid square that encompasses the study area have been used in this assessment. The baseline period 1981 – 2010 and 25km grid resolution allow comparison to the future UK climate projections produced by the Met Office, referred to as the UK Climate Projections 2018 (UKCP18). The UKCP18 uses a 30-year baseline period from which potential climatic changes in future years are projected.
UKCP18 uses scenarios for future greenhouse gases called Representative Concentration Pathways (RCPs), which cover a range of assumptions around future population, economic development and include the possibility of mitigation of GHG emissions towards international targets. The RCPs are expressed for future radiative forcing targets of 2.6, 4.5, 6.0 and 8.5 watts per square metre (W m2) in 2100 (RCP2.6, RCP4.5, RCP6.0 and RCP8.5 pathways). Each pathway drives a different range of projected global mean temperature increases over the 21st century, taking account of uncertainty in aspects such as the transient climate response and rate of ocean heat uptake.
The RCP pathways lead to a broad range of climate outcomes but are neither forecasts nor policy recommendations. RCP2.6 represents a scenario where there are sizeable reductions in emissions of GHG. This scenario gives a reasonable chance of limiting global average warming to between 1.5 and 2°C above pre-industrial levels. RCP8.5 represents a scenario in which global GHG emissions continue to rise uncontrolled with temperature increases exceeding 4°C by the end of the century.
The future climate projections considered within this assessment are for the RCP 8.5 high emissions scenario, at a 50% probability of occurrence (i.e. the 50th percentile value of the dataset) in accordance with paragraph 3.28 of DMRB LA114. Climate projections were obtained for the following periods:
- The 2030s (2020 – 2049): covering the period of possible construction and opening years in the short term.
- The 2060s (2050 – 2079): covering a period during operation in the medium term.
- The 2080s (2079 – 2099): covering a period during operation over the long term which represents the end of the temporal scope for the climate change resilience assessment of 60 years after an indicative opening of around 2030 (in accordance with paragraph 3.31 of DMRB LA114).
The 25km UKCP18 probabilistic projections for the 25km-by-25km grid square located centrally within the area where the proposed scheme is located were used. This is centred on the following Easting and Northing: E 287500 N 562500. The 25km-by-25km grid box is shown in Figure 14-2. The climate projections for the proposed scheme location are presented in Table 14-3 .
| Climate Variable | Observed Baseline (1981-2010) | Projected Change (RCP8.5, 50% probability) - 2030s | Projected Change (RCP8.5, 50% probability) -2060s | Projected Change (RCP8.5, 50% probability) -2080s |
|---|---|---|---|---|
|
Mean summer monthly maximum temperature |
18.0 ᴼC |
+1.1 ᴼC |
+2.7 ᴼC |
+4.5 ᴼC |
|
Mean winter monthly minimum temperature |
0.9 ᴼC |
+0.8 ᴼC |
+2.0 ᴼC |
+2.9 ᴼC |
|
Mean annual monthly temperature |
8.7 ᴼC |
+0.9 ᴼC |
+2.1 ᴼC |
+3.2 ᴼC |
|
Mean summer accumulated rainfall |
278.7mm/yr |
-7.1% |
-19.7% |
-29.7% |
|
Mean winter accumulated rainfall |
382.7mm/yr |
+8.9% |
+18.6% |
+31.4% |
|
Mean annual accumulated rainfall |
1336.0mm/yr |
+2.5% |
+3.7% |
+5.9% |
The current and future climate projections for the 25km grid square covering the study area indicate that the following have the potential to occur:
- Increases in the annual average temperature for the region of 0.9ºC in the 2030s, 2.1ºC in the 2060s and 3.2ºC in the 2080s, with larger projected increases in maximum summer temperatures.
- Decreases in summer rainfall (around 29.7% by the 2080s) and an increase in rainfall in the winter months (around 31.4% by the 2080s).
Table 14-4 sets out the UKCP18 climate projection data (RCP8.5 scenario) for a number of climate extreme indices, which were derived from the UKCP18 12km daily projections dataset. These daily projections are for the grid square centred on E 282000, N 570000, which contains the study area (see Figure 14-2). The time periods presented broadly align with those of the 25km projected data, albeit with two differences, as the upper limit of the 12km dataset is 2080. Consequently the 2080s period could not be represented in the same manner as the 25km dataset, and the 2060s period has been extended by one year to include 2080 so that the full range of available values are incorporated.
The data in Table 14-4 show an increase in the number of days with high temperatures, hot spells, heatwaves, dry spells, and droughts. The number of air frost days is projected to decrease and there is not expected to be a large change in the number of heavy rain days.
Unlike the 25km datasets, there are no equivalent ‘observed’ data, therefore the data presented for all three periods are projected values. The ranges provided for each metric represent the minimum and maximum 50th percentile (median) projected values from the 12 ensembles (for example, model runs) used by the Met Office in the UKCP18. To note, 25 ᴼC is defined by the Met Office as the threshold for heatwaves in this region.
| Climate Extreme Metric | Projected Values (RCP8.5, 50% probability) - Baseline (1981-2010) | Projected Values (RCP8.5, 50% probability) -2030s (2020-2049) | Projected Values (RCP8.5, 50% probability) – 2060s (2050-2080) |
|---|---|---|---|
|
Annual number of days when mean temperature greater than 25°C |
0 to 0 |
0 to 1 |
0 to 3 |
|
Annual air frost days (no. of days with min temp below 0°C) |
5 to 34 |
4 to 20 |
1 to 8 |
|
Annual hot spells (no. of periods with max. daily temp greater than 25°C for two consecutive days) |
0 to 0 |
0 to 2 |
0 to 8 |
|
Annual heatwaves (no. of periods with max. daily temp greater than 25°C for three consecutive days) |
0 to 0 |
0 to 1 |
0 to 6 |
|
Annual heavy rain days (no. of days when total precipitation is greater than 25mm) |
11 to 11 |
8 to 14 |
10 to 15 |
|
Annual drought events (no. of periods when daily total precipitation is less than 0.2mm for 15 consecutive days) |
0 to 1 |
0 to 1 |
1 to 3 |
|
Annual dry spells (no. periods when daily total precipitation is less than 1mm for 15 consecutive days) |
2 to 7 |
3 to 7 |
5 to 11 |
The magnitude of future changes to windstorms is subject to large uncertainty. However, the projections indicate some potential for the number of storms to increase over the UK by the 2080s for RCP8.5, although the increases are relatively small.
Potential Impacts
Construction
Greenhouse Gas Emissions
As detailed in the AR6 Synthesis Report: Climate Change 2023 , human-caused GHG emissions have already had an impact on climate change, affecting many weather and climate extremes across the world and these adverse impacts will continue to intensify. Also, an increase in national GHG emissions has the potential to hinder the UK and Scottish Governments in meeting their respective carbon reduction targets.
It is expected that GHG emissions would be released during the construction of the proposed scheme. During the construction phase, GHGs are expected to be emitted through the carbon embodied in the materials used to construct the proposed scheme and their transport to the construction areas, from the transport and treatment of waste, from the transport of workers to and from construction areas and fuel/energy/water used during construction works.
Changes in land use would also result in GHG emissions during construction, for example, through the disturbance and loss or removal of carbon sinks, for example areas of woodland or peat bogland, refer to the Biodiversity Chapter and Geology, Soils and Groundwater Chapter of this EAR.
Vulnerability of the Proposed Scheme to Climate Change
All improvement strategies could potentially be impacted by climate change related impacts during construction as a result of changes in typical and extreme weather conditions. This could lead to the disruption of construction activities and potentially cause delays and / or increased costs (for example, through the flooding of construction areas causing damage to materials and assets). Proposed scheme-related receptors with the potential to be affected by climate impacts during construction include the workforce, plant and machinery. Highway assets under construction may also be affected, including structures, embankments, soft estate and drainage.
Table 14-5 lists the typical receptors for consideration in the vulnerability assessment and these are anticipated to apply to all improvement strategies. The elements of the receptors likely to be impacted are also presented along with the potential impact on them.
| Receptor | Climate Event | Impact | Element Impacted |
|---|---|---|---|
|
Geotechnical engineering structures such as embankments |
Increased peak rainfall. |
Flooding and soil erosion of incomplete structures. Disruption to supply of materials and goods to the construction sites. |
Stability of earthworks/slopes and compaction. Drainage ditches. Subcontractors and supply chain. |
|
Structures such as bridges and retaining walls |
Increased peak temperatures and peak rainfall. |
Flooding and soil erosion of incomplete structures. Weakening or wash-out of structural soils during construction (if relevant). Disruption to supply of materials and goods to the construction sites. |
Bridges, retaining walls and other structures, including access tracks Subcontractors and supply chain. |
|
Workforce |
Increased peak temperatures and peak rainfall. |
Flooding. Exacerbation of dust generation and dispersion by warm and dry conditions. Health risks to on-site personnel. |
Workers. Subcontractors. Auditing authorities. |
|
Construction assets |
Increased peak temperatures and peak rainfall. |
Stress on technology. Damage. Increased maintenance costs. |
Machinery. Equipment. Compounds and temporary structures/facilities. |
Operation
Greenhouse Gas Emissions
It is expected that GHG emissions would be released during the operation of all improvement strategies. Once in operation, the proposed scheme would have the potential to alter GHG emissions through the consumption of fuel, energy and raw materials, for example, energy for lighting, carbon embodied in replacement materials and fuel used during maintenance activities.
The proposed scheme would also alter GHG emissions from the use of the road network by end-users, as vehicle flows and speeds on the surrounding road network (and associated fuel consumption) are likely to change compared to the baseline situation.
Changes in land use would also have impacts on climate during operation as land containing carbon sinks such as soils, vegetation and woodland is replaced by the physical assets associated with the proposed scheme. This could lead to ongoing GHG emissions as land use types which typically store carbon in soil are replaced with land use types which would lead to losses of soil carbon sinks, for example areas woodland or peat bogland, refer to the Biodiversity Chapter and Geology, Soils and Groundwater Chapter of this EAR.
Vulnerability of the Proposed Scheme to Climate Change
All improvement strategies could potentially be impacted by climate change during operation as a result of changes in typical and extreme weather conditions. This could lead to adverse impacts on the proposed scheme infrastructure such as damage to assets (for example, road pavements, structures, embankments, soft estate and drainage), disruption on the road network during operation for end users (for example members of the public and commercial operators) through flooding and / or additional stress on, and degradation of, structures and road surfaces from temperature extremes or heavy rainfall events.
Table 14-6 lists the typical receptors for consideration in the vulnerability assessment and these are anticipated to apply to all improvement strategies. The elements of the receptors likely to be impacted are also presented along with the potential impact on them.
| Receptor | Climate Event | Impact | Element Impacted |
|---|---|---|---|
|
Geotechnical engineering structures, for example, embankments |
Increased peak rainfall. |
Flooding and soil erosion. |
Stability of earthworks/ slopes and compaction. Drainage ditches. |
|
Structures for example, bridges and retaining walls |
Increased peak temperatures and peak rainfall. |
Flooding and soil erosion. Water scour causing structural damage. Weakening or wash-out of structural soils. Increased thermal range giving rise to increased earth pressures on retaining walls and other structures. |
Bridges, retaining walls and other structures. |
|
Workforce |
Increased peak temperatures and peak rainfall. |
Flooding. Health risks to on-site personnel. |
Maintenance workers and subcontractors. |
|
Pavements |
Increased mean/peak temperatures and peak rainfall. |
Flooding and erosion. Increased requirement for maintenance and repair. |
Materials integrity. |
|
Signs, signals and gantries |
Increased peak winds. |
Damage from wind-borne debris. Damage from wind load. |
Stability. Renewal and repair. |
|
Soft estate |
Increased mean/peak temperatures, peak wind and peak rainfall. Increased drought and dry spells. |
Damage to trees and vegetation. Fire causing damage to soft estate. |
Landscaping. |
|
Operational road users |
Increased mean/peak temperatures, peak wind and peak rainfall. |
Damage and delays from wind-borne debris. Driving safety. |
Private and commercial transportation. |
Design, Mitigation and Enhancement Measures
Mitigation Measures - Construction Phase
Greenhouse Gas Emissions
DMRB LA 114 - states that projects should be designed to minimise GHG emissions in all cases to contribute to the UK’s target (and by default Scotland’s) for a net reduction in carbon emissions over time, and notes that minimising GHG emissions through design is also a core principle of the Infrastructure Carbon Review and the specification on carbon management in infrastructure within PAS 2080:2023 Carbon Management in Infrastructure (hereafter referred to as “PAS 2080:2023”).
The improvement strategies which reduce the amount of construction required and maximise the potential for re-using and/or refurbishing existing assets to reduce the extent of new construction required (such as avoiding emissions) would result in lower GHG emissions.
Some examples of design, mitigation and enhancement measures for the construction phase include:
- Refine the designs to use less materials, for example through optimising the depth of sub-base, the height of embankments or depth of cuttings required or designing structures such as retaining walls that require less material to construct.
- Increased recycled content of asphalt or concrete resulting in lower embodied carbon in construction materials.
- Local sourcing of materials to reduce transport distances and reuse of aggregate and site won material on-site or sharing resources with other nearby construction projects.
- Low carbon/more efficient construction processes and activities. For example, using zero-emission construction plant and use of renewable energy to power construction compounds and site equipment where feasible. Other measures could be considered to increase fuel efficiency during construction or to reduce fuel and / or water use and the generation of waste.
Vulnerability of the Proposed Scheme to Climate Change
Good engineering practice would be applied during construction by the chosen contractors to increase the resilience of the construction activities to extreme weather events. Specific measures would be included in the Environmental Mitigation Plan (EMP), or equivalent, in order for their implementation to be secured and could include:
- Determining appropriate locations for site offices and facilities and storage areas for materials.
- Suitable management of site drainage.
- Using weather forecasting and developing plans for extreme weather events.
Enhancement Measures – Construction Phase
No enhancement measures have been identified at the time of reporting which are over and above those mitigation measures already specified above. Potential enhancement opportunities would be explored and presented for the construction phase at later DMRB stages.
Mitigation Measures – Operational Phase
Greenhouse Gas Emissions
Designing the proposed scheme with a view to maximising the operational lifespan of key materials, such as surfaces and structures and minimising the need for, and frequency of, maintenance and refurbishment would be one of the key mitigation measures to reduce GHG emissions. Others include incorporating renewable energy technology where feasible, for example to power road signs, and the use of energy-efficient roadside signage and lighting (such as Light Emitting Diode (LED) lighting). These would be explored further at later DMRB Stages, for example DMRB Stage 2 and beyond.
Vulnerability of the Proposed Scheme to Climate Change
It is expected that the vulnerability of the proposed scheme to potential long-term weather changes and to intensified extreme weather conditions would be addressed through design in the context of good engineering practice and the application of the most up to date design standards and climate change allowances.
As required by DMRB LA 114, appropriate ongoing asset management procedures to monitor asset performance with regard to weather events and climate change would be implemented. This would be used to feed into adaptive management measures or take corrective action to address any issues which have arisen through climate change.
Enhancement Measures – Operational Phase
Opportunities for enhancement include measures to further mitigate climate related impacts on road surfaces and pavements or to embankments and earthworks such as:
- Consideration of more resilient materials which are less sensitive to temperature extremes or changes in temperature to mitigate against rutting or cracking and fretting of the carriageway.
- Use of a drainage blanket layer to aid drainage and improve slope stability.
- Use of granular materials in embankments which are less susceptible to weathering.
- Additional drainage or sub-surface drainage requirements where groundwater levels are close to the base of embankments.
Assessment of Likely Significant Effects
Greenhouse Gas Emissions
Due to the limited data available for this DMRB Stage 1 (i.e. only improvement strategies being available) it is assumed that construction (and maintenance and non-user operation emissions) is likely to be proportionate to:
- The improvement strategy length.
- River crossings – there is one substantial river (Urr Water) in the area that several of the improvement strategies cross which would entail bridge construction.
- The total number of new major structures needed.
- Table 14-7 presents the high-level results of this analysis. This assessment does not take into account other elements of the design such as the need for earthworks and embankments which will be assessed when data is available, such as at DMRB Stage 2.
- Due to the broadly defined nature of the improvement strategies, the numbers of retaining walls, culverts and minor bridges (expected length of less than 20m) have not been included in Table 14-7. Minor structures will be assessed at DMRB Stage 2.
| Improvement Strategy | Approximate Length (km) | Crosses Urr Water | Indicative Number of New Major Structures |
|---|---|---|---|
|
Improvement Strategy 1 |
19.0 |
Yes |
4 |
|
Improvement Strategy 2 |
12.4 |
No |
2 |
|
Improvement Strategy 3 |
5.4 |
No |
1 |
|
Improvement Strategy 4 |
6.0 |
No |
2 |
|
Improvement Strategy 5 |
11.0 |
Yes |
1 |
|
Improvement Strategy 6 |
17.2 |
Yes |
3 |
Improvement Strategy 1 is entirely offline, crosses Urr Water and would likely require the most new major structures. It is therefore likely to require more construction works (and would likely result in higher construction GHG emissions) than the other improvement strategies. Improvement Strategy 3, which is online, would not require as many new major structures to be constructed as most other improvement strategies and is likely to result in the least construction and associated GHG emissions.
No assessment of the increase in road transport emissions can be made at this stage as traffic data is not available. However, if additional capacity is added to a road such as the A75, this has the potential to result in an increase in traffic flows and higher road traffic GHG emissions.
Vulnerability of the Proposed Scheme to Climate Change
The likely receptors related to the proposed scheme’s vulnerability to climate change were identified in the Potential Impacts section of this chapter (Table 14-5 and Table 14-6) along with their vulnerable elements and the likely impacts for the relevant climate events. The types of receptors are not expected to differentiate considerably between the improvement strategies as many of the receptor types are common to them all, with the exception of those with major water crossings (for example bridges). As all of the improvement strategies are in relatively close proximity to each other, the climate conditions currently, or projected to be, experienced in the study area are considered to be the same for each improvement strategy. Therefore, in terms of direct exposure to adverse weather conditions, all the receptors, regardless of the improvement strategy, are considered to be at a similar risk, with the exception of those with major water crossings (for example bridges), which would be at a higher risk.
The climate projections, set out in the Baseline Conditions of this chapter, show that there is the potential for increased temperatures to impact on the construction and operation phases, with larger increases in temperatures projected to occur over the operation phase. The increased temperatures, including periods of longer, drier conditions during summer, could impact several proposed scheme receptors identified in Table 14-5 and Table 14-6 including engineering structures, workforce, construction assets, pavement, soft estate and road users.
The projected increased seasonal rainfall, particularly during the winter months, and increased extreme daily rainfall rates could lead to surface water flooding and soil erosion which could also impact on geotechnical structures such as embankments, engineering structures, workforce, construction assets, pavements, soft estate and road users.
The climate projections indicate that impacts to receptors, for example, signs, signals and gantries, soft estate and road users due to increased wind speeds are unlikely to differ substantially compared to the existing situation.
The Road Drainage and the Water Environment Chapter of the EAR acknowledges that climate change can impact flood risk and should be taken into account in the assessment. The chapter further discusses water courses and the likelihood of flooding in the context of the improvement strategies. This indirect exposure of the proposed scheme to flood risk, which could be exacerbated by climate change particularly with regard to flooding from rivers and watercourses, is a key risk which needs to be considered as flooding could impact on several receptors listed in Table 14-5 and Table 14-6 .
However, as set out in the Design, Mitigation and Enhancement Measures section of this chapter, it is anticipated that appropriate climate change adaptation measures would be embedded into the designs and via an EMP, which would be aligned to the requirements outlined in DMRB CG 501 - Design of highway drainage systems (version 2.1.0) . The implications on the design through the consideration of climate change allowances will be developed and reported on through DMRB Stage 2 and Stage 3.
It is not possible to specify the significance of the adverse effect of climate change on the proposed scheme at this stage, although it is assumed that the vulnerability of each improvement strategy to climate change could be addressed through appropriate design and management practices and thus is unlikely to represent a significant effect. However, this would be assessed in greater detail at later DMRB Stages. As noted in the Assumptions and Limitations section of this chapter, consideration of the in-combination impacts on receptors in the surrounding environment and the potential cumulative effect with other transport infrastructure would be assessed at DMRB Stage 2 and 3.
Proposed Scope of Future Assessment
At DMRB Stage 2, it is proposed that design and modelled traffic data is used to estimate changes in GHG emissions for each route option, from at least construction and road traffic, to allow a more detailed assessment to be undertaken as well as to inform the design of potential measures to reduce proposed scheme-related GHG emissions going forward. These estimated changes in GHG emissions would allow the potential impact of each option on climate to be compared.
Ideally, impacts on existing carbon stores and sinks such as peat bogs and woodland areas as a result of each route option would be minimised or avoided where possible. Such impacts would not be quantified at DMRB Stage 2 but instead would be considered qualitatively for each route option.
Similarly, from a vulnerability perspective, work would be undertaken to assess climate risks in more detail such as landslide risks and would include working with designers and the flood risk team to help to understand potential flooding issues. Potential climate risks relevant to each route option would then be identified at a high level in order to assess whether there are any potential differentiators between route options.
Summary
A high level qualitative assessment of the improvement strategies has been undertaken at DMRB Stage 1 as summarised in Table 14-7. This is due to limited design and traffic data which is a common constraint at this early stage of the process. Improvement Strategy 1 is entirely offline, crosses Urr Water and would likely require the most new major structures. It is therefore likely to require more construction works (and would likely result in higher construction GHG emissions) than the other improvement strategies. Improvement Strategy 3, which is online, would not require as many new major structures to be constructed as most other improvement strategies and is likely to result in the least construction and associated GHG emissions.
The likely receptors related to the proposed scheme’s vulnerability to climate change were identified in the Potential Impacts section of this chapter (Table 14-5 and Table 14-6) along with their vulnerable elements and the likely impacts for the relevant climate events. The types of receptors are not expected to differ considerably between the improvement strategies as many of the receptor types are common to them all, with the exception of those with major water crossings (for example bridges).
As all six improvement strategies are in relatively close proximity to each other, the climate conditions currently, or projected to be, experienced in the study area are considered to be the same for each improvement strategy. Therefore, in terms of direct exposure to adverse weather conditions, all the receptors, regardless of the improvement strategy, are considered to be at a similar risk, with the exception of those with major water crossing (for example bridges), which would be at a higher risk.
Therefore, at DMRB Stage 2 further work is required to inform the selection process for a preferred route option as set out in The Proposed Scope of Future Assessment section of this chapter.