Improves our health and wellbeing
This section provides data on:
- Indicator 4A: Proportion of Short Journeys Made by Active Travel (primary indicator)
- Indicator 4B: Transport Casualties and Accidents by Exposure or by km Travelled by Mode (primary indicator)
- Indicator 4C: Perceptions of Safety Travelling by Public Transport and Active Modes (primary indicator)
- Indicator 4D: Air Quality Measure (primary indicator)
- Indicator 4E: Travel for Recreation/Leisure (secondary indicator)
Indicator 4A: Proportion of Short Journeys Made by Active Travel
- Almost half of journeys under two miles are made by active modes, as are around a third of journeys under five miles.
Data on travel by active modes (walking, wheeling and cycling) comes from the Scottish Household Survey. The data for this indicator and the specific breakdowns by group provided here is a product of bespoke statistical analysis undertaken by Transport Scotland. Components of the data used for this indicator is also used as a National Indicator within the National Performance Framework (NPF). Active modes here refers to walking, wheeling or cycling. Additional data, including a breakdown of journeys by length, can be found in the accompanying dataset.
Journeys under two miles
- Looking at journeys under two miles, 49% of all trips are by active modes. Of all journeys made under two miles, 48% are by walking and 2% are by cycling. Looking at walking, data from the NPF shows that, in 2012, the proportion of journeys under 2 miles made by walking was 49%.
- Men made 51% of trips under two miles by active modes, compared to 48% of the trips taken by women. Among those on the 30% of lowest incomes, 56% of journeys were made in this way, compared to 44% of those in the highest 30%. Among the younger age groups, 20-29 year olds made 65% of their trips by active modes, compared to 44% of those aged 50-59.
Journeys under five miles
Looking at journeys under 5 miles, 35% of all trips are by active modes. Of these trips, 33% were by walking while 2% were by cycling. Looking at the data from the NPF, in 2012 the proportion of journeys of this length made by cycling was similar, at 2%.
A higher percentage of journeys were made using active travel modes in urban areas (36%) compared to rural areas (31%), and by people in the lowest 30% of the income distribution (41%) compared to the highest 30% (30%). Among men, 36% of the journeys under five miles were made by active modes, compared to 34% of the journeys made by women. Travel by active travel modes also varies in terms of age, with those aged 20-29 took 46% of their journeys by active methods, compared to 29% of those aged 50-59.
Indicator 4B: Transport Casualties and Accidents by Exposure and by km Travelled by Mode
- Traffic Casualties vary by gender, deprivation, location and mode.
This data comes from the Reported Road Casualties in Scotland report, specifically the 2019 and 2020 editions. The specific statistical breakdowns by SIMD deciles was produced by bespoke analysis for the purposes of this report.
In terms of the SIMD figures, it should be noted that the figures relating to the address of the person exclude cases where the address is not known and these figures, on the whole, exclude casualties where the age of the person is not known.
Overall Casualties
- In 2019, there were 7,745 overall casualties. These included:
- 5,649 slight injuries;
- 1,930 serious injuries, and
- 166 deaths
- Among adults (aged 16 and over), this was 6958 overall. This included:
- 5,042 slight injuries
- 1,752 serious injuries
- 164 deaths
- Among children (aged 0-15) this was 773 overall. This included:
- 595 slight injuries
- 176 serious injuries
- 2 deaths
By Geography
- Overall casualties in 2019 were highest in Glasgow City, at 1,100, and lowest in both the Orkney and Shetland Islands, at 27. Deaths, however, were highest in Highland, at 21, followed by Fife, at 15.
- However, there is a slightly different pattern per capita. Here:
- Overall, casualties in 2019 were highest in Argyll & Bute, at 2.46 casualties per 1,000 people (211 total casualties from 85,870 people). Fatalities were also highest in this area, at 0.1 fatalities per capita (9 fatalities out of the population above).
By SIMD decile of the person involved
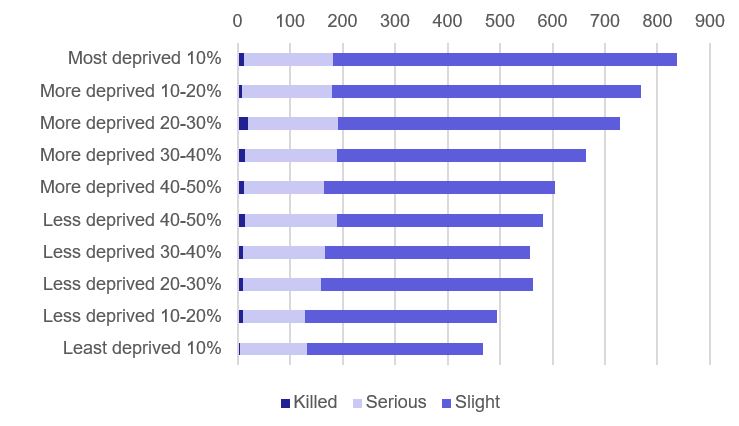
The general trend is that casualties increase with the deprivation decile of the address of the person involved. Overall casualties were highest, at 838, among those in the most deprived 10% of addresses and were lowest, at 467, among those in the least deprived 10% of addresses. This can be seen in Figure 3. It should be noted that these figures exclude those casualties where the address of the person involved was not known, as well as those where the age of the person involved is unknown. Overall casualties in this context is the combined figures from the distinct modes listed below, i.e. child and adult pedestrians, child and adult motor vehicle drivers, child and adult passengers and child and adult pedal cyclists.
- In terms of adult casualties (16 and over) and specific modes, in 2019:
- Among adult pedestrians, overall casualties peaked among those in the most deprived 10% of addresses, at 145, compared to 56 in the least deprived 10% of addresses. The lowest number of casualties was among the less deprived 10-20% of addresses, at 45.
- Among adult motor vehicle drivers, overall casualties peaked among those in the more deprived 20-30% of addresses, at 365. This is compared to 221 in the least deprived 10% of addresses. There were 352 casualties among the those in the most deprived 10% of addresses.
- Among adult passengers, overall casualties peaked at 181 among those in the most deprived 10% of addresses, compared to 70 among the least deprived 10% of addresses.
- Among adult pedal cyclists, the trends reversed, with a peak of 88 casualties among those in the least deprived 10% of addresses, compared to 39 among those in the most deprived 10% of addresses. However, the lowest number was 26, among those in the more deprived 40-50% of addresses.
- Among children (aged 0-15) and specific modes, in 2019:
- Among child pedestrians, casualties peaked at 63 among those in the most deprived 10% of addresses, compared to 8 among those in the least deprived 10% of addresses.
- Among child passengers, casualties peaked among those in the most deprived 10% of addresses, at 49, compared to 17 in the least deprived 10%. The lowest number, however, was 12 among those in the less deprived 10-20% of addresses, respectively.
- Among child pedal cyclists, casualties peaked at 9 among those in the more deprived 20-30% of addresses (with 8 among those in the most deprived 10% of addresses). The lowest number was 2, among those in the less deprived 10-20% of addresses.
- Overall, there were 4 casualties associated with child vehicle drivers, so trends cannot be extrapolated from these numbers.
By SIMD decile of the location of the accident
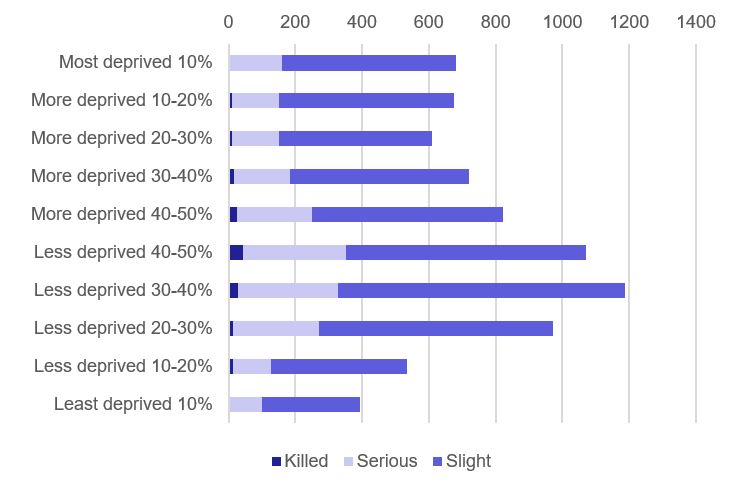
Here, when looking at the SIMD decile of the location where the accident occurred, the trend is more complex. When looking at pedestrians, there appears to be a consistent association between deprivation and volume of casualties. However, when it comes to casualties associated with motor vehicle drivers/passengers, the link between the deprivation of the location and the volume of casualties is less clear, and the most deprived locations are not always those associated with the greatest number of casualties. these figures exclude those casualties where the age of the person involved is unknown.
- In terms of adult casualties (16 and over) among specific modes, in 2019:
- Among adult pedestrians, casualties peaked at 141 in the most deprived 10% of areas, compared to 55 in the least deprived 10% of areas.
- Among adult drivers of motor vehicles, casualties peaked at 664 in the less deprived 30-40% of areas, with the lowest number of casualties at 177 in the least deprived 10% of areas, followed by 281 in the most deprived 10% of areas.
- Among adult passengers, casualties peaked at 286 in the less deprived 30-40% of areas, with the lowest number of casualties at 61 in the least deprived 10% of areas, followed by 98 in the more deprived 20-30% of areas and in the less deprived 10-20% of areas.
- Among adult pedal cyclists, casualties peaked at 74 in the less deprived 30-40% of areas (with 73 in the least deprived 10% of areas) while the lowest number of casualties was 40 in the more deprived 10-20% of areas (with 43 in the most deprived 10% of areas).
- In terms of child casualties (0-15), in 2019:
- Among child pedestrians, casualties peaked at 65 in the most deprived 10% of areas, while the lowest number was 14 in the least deprived 10% of areas.
- Among child passengers, casualties peaked in the less deprived 30-40% of areas and 20-30% of areas, at 66. The lowest number of casualties was 13, in the least deprived 10% of areas.
- Among child pedal cyclists, casualties peaked at 11 in both the more deprived 20-30% of areas and in the more deprived 10-20% of areas. The lowest number of casualties was 2, in the least deprived 10% of areas.
- Overall, there were 8 casualties associated with child vehicle drivers where the location is known, so trends cannot be extrapolated.
By Demographic
- Casualties are more common among men then among women. In 2019, there were 1,340 killed or seriously injured casualties among men and 754 among women. Looking at deaths specifically, in 2019, 109 men died compared to 57 women.
- In 2019, casualties for all severities peaked among those aged 30-39, at 756 men and 508 women.
By Mode
- In 2019, the greatest number of casualties was experienced by those in cars (4,626 casualties overall). In this year, there were 3,668 slightly injured, 882 seriously injured and 76 killed using this mode.
- By contrast, among pedestrians, there were 1,265 casualties overall, with 758 slight injuries, 463 serious injuries and 44 fatalities. Among pedal cyclists, there were 592 overall casualties, with 399 slight injuries, 183 serious injuries and 10 fatalities.
By Distance
- Using distance travelled by modes in Scotland, provided by the Department for Transport, we can estimate the number of accidents by kilometre travelled on each mode. However, it should be noted that, given the nature of the data collection, the figures for pedal cycles are unlikely to be as precise as those for motor vehicles. As a result, statistics should be treated with caution.
- This demonstrates that, per million kilometres travelled in a car, there are 0.12 casualties, which includes 0.002 fatalities. By contrast, the highest number of casualties is associated with motorcycles (1.62 per million kilometres) and pedal cycles (1.61 per million kilometres).
- Regarding fatalities, these are highest on motorcycles, at 0.08 per million kilometres. Motorcycles also have the highest rate of serious injuries per million kilometres, at 0.85.
Indicator 4C: Perceptions of Safety of Public Transport and Active Modes
- More than one in ten women and disabled people disagreed that they felt safe and secure on the bus or the train in the evening.
Data on perceptions of safety buses and trains is provided by the Scottish Household Survey. This section contains some bespoke breakdowns specifically developed for this report. In terms of Active Modes, this section uses data already referenced above on the barriers to cycling to work and data on reasons for not walking more often, sourced from the Scottish Household Survey and, in the case of cycling, data broken down specifically for this report.
Walking
- Within the data provided by the Scottish Household Survey, 1% of the population cited ‘not safe’ as a barrier to walking more frequently than they do. This proportion has remained consistent since 2012, with the question being asked in 2012, 2013, 2014, 2015 and 2019. Because the sample size of the those providing this answer was so low, a breakdown by demographics is not available.
- However, it is worth noting that the Scottish Crime and Justice Survey collects data on the proportion of adults that felt safe walking alone in their local area. This survey notes that, in 2019-20, 77% of respondents felt safe in this context. More specifically, 65% of women felt safe, compared to 90% of men. In addition, 63% of those in the 15% most deprived areas felt safe compared to 79% of those in the rest of Scotland (reported in the data tables accompanying the survey).
- The overall proportion of those feeling safe has increased over time and is 11 percentage points higher than it was in 2008/09.
- While this data is not strictly comparable to the survey data above, it provides some additional context for understanding perceptions of safety while walking.
Cycling to work
- Within the data provided by the Scottish Household Survey, there were two answers to the question asking for ‘Reasons why do not cycle to work’ that relate to personal safety. These are ‘Concerns about cycling in traffic’ and ‘Concerns for personal safety on dark/lonely roads’. This data has been disaggregated in a bespoke breakdown provided for this report.
- In relation to concerns about traffic, this was reported by 21% of respondents. It was higher among women (24%) than among men (17%). It was also higher in urban areas (23%) than in rural areas (13%).
- In relation to concerns about personal safety on dark/lonely roads, this was reported by 13% of respondents overall. This was higher among women (16%) than among men (8%).
Bus
- Perceptions of safety were higher during the day than in the evening. During the day, 93% agreed they felt safe and secure using the bus. By contrast, 69% agreed that they felt this way using the bus in the evening while 9% disagreed. Looking at specific groups:
- Disagreement with feeling safe and secure during the evening was higher among women, at 12%, compared to 5% among men. It was also higher among disabled people (at 14%) compared non-disabled people (at 7%).
- Disagreement was also higher among those in the lowest 30% of incomes, at 11%, compared to those in the highest 30% of incomes, at 6%.
Train
- Among those who had used the train in the last month, 95% agreed that they felt safe and secure using the train during the day. By contrast, 76% agreed that they felt this way during the evening while 10% disagreed.
- Disagreement was higher among women compared to men (14% compared to 5%) and among disabled people compared to non-disabled people (15% compared to 9%).
Indicator 4D: Air Quality
- Air pollution from Nitrous Oxide and PM10/PM 2.5. is decreasing, but transport remains a significant contribution.
This section considers the two primary air pollutants referenced in the National Transport Strategy, Nitrous Oxide (NOx) and Particulate Matter (primarily PM 10 and PM 2.5). The data comes from the ‘Environment and Emissions’ chapter of the Scottish Transport Statistics Report no. 40 (2021 edition). The difference between PM 10 and PM 2.5 relates to their size, with PM 10 being sized 10 microns and below and PM 2.5 being 2.5 microns and below.
It should be noted that the data does not exhaust the available data on air pollution and air quality monitoring. Further data on these can be found in the links above.
Nitrogen oxides (NOx)
- In 2019, 57% of all NOx emissions were from transport, which is an increase from 1990 when transport comprised 45% of overall emissions. However, this is in a context where both overall and transport related emissions have declined considerably overall. In absolute terms, NOx emitted from Transport has fallen by from 150.5 thousand tonnes in 1990 to 47.8 thousand tonnes (a fall of around 68%).
- Looking at road transport, the relative components of this have changed over time. In 1990, road transport represented 70% of transport emissions, while shipping represented 26%. In 2019, road transport constituted 49% of all transport emissions, while shipping constituted 43%.
- In terms of road transport, in 2019, diesel passenger vehicles accounted for 43% of these emissions, while 37% of this came from diesel light goods vehicles. HGVs accounted for 9% of these emissions.
Particulate Matter (PM 10)
- Overall transport related PM 10 emissions have fallen from 7 thousand tonnes in 1990 to 2.5 thousand tonnes in 2019. In 2019, transport related emissions related to 17% of all PM 10 emissions, the same number that was reported in 1990.
- Emissions associated with road transport, as a percentage of emissions associated with total transport, increased from 43% in 1990 (when shipping was 53%) to 69% in 2019 (when shipping was 28%). In 2019, in terms of specific components of road transport, 51% was related to tyre and brake wear and 27% was related to road abrasion.
Particulate Matter (PM 2.5)
- In 2019, 21% of total PM 2.5 emissions came from transport, compared to 23% in 1990. In absolute terms, however, transport related PM 2.5 emissions fell from 6.4 thousand tonnes in 1990 to 1.8 thousand tonnes in 2019.
- Road transport as a component of transport emissions increased from 40% in 1990 - when shipping was 56% - to 60% in 2019, when shipping was 36%. In terms of the specific components of road transport, in 2019, 44% of the total was a result of tyre and brake wear and 23% was a result of road abrasion.
Indicator 4E: Travel for Recreation/Leisure
- Just over a quarter of travel is for leisure.
Data in this section comes from the Travel Diaries published as part of the Scottish Household Survey. The breakdown by group by provided via bespoke analysis by Transport Scotland. The distinction between leisure and non-leisure has been made for the purposes of addressing the indicator, as above, and is not reflected in the original statistics.
- Looking at journeys by purpose, 27% of travel is for recreation/leisure, compared to 72% of travel that be characterised as non-leisure. Leisure travel here includes visiting friends or relatives (10%), going for a walk (7%), sports/entertainment (6%), eating/drinking (3%) and holidays/days trips (1%).
- By contrast, non-leisure activities include shopping (24%), commuting (23%), going home (7%), education (6%), other personal business (5%), business (2%), visiting hospital or other health reasons (2%) or ‘other’ journeys (1%). In total, these comprised 72% of all journeys.
- There are a range differences by group. Some of the most prominent included:
- Looking at gender, a larger percentage of men’s trips involved commuting (26%), business (4%) and entertainment/sports (7%), compared to women (21% of which were commuting, 1% of which were for business and 5% of which were for entertainment/sports, respectively). A larger percentage of women’s trips were to education (7%) compared to men (4%) and a greater percentage were concerned with visiting friends or relatives (11% compared to 9% of men’s trips).
- Looking at age, commuting is highest among 20-29 year olds, at 32% of journeys, and is lower among those over 60 (13% of those aged 60-69, 2% of those aged 70-79). Education trips are most common among those aged 16-19, at 20%.
- Looking at disability, a lower proportion of the trips of disabled people involved commuting (13% compared to 26% of non-disabled people).
- Looking at income, a higher proportion of trips of those in the highest 30% of incomes involved commuting (28%) compared to those in the lowest 30% of incomes (15%). By contrast, a higher proportion of those in the lowest 30% of incomes involved shopping (29%) compared to those in the higher 30% of incomes (19%).
- Looking at geography, a higher proportion of the trips of those in urban areas involved commuting (24%, compared to 20% of trips of those in rural areas).
< Previous | Contents | Next >