Takes climate action
This chapter provides baseline data on four key indicators:
- Indicator 2A: Transport Emissions (primary indicator)
- Indicator 2B: Sustainable Mode Share (primary indicator)
- Indicator 2C: Movement of Freight by Mode (primary indicator)
- Indicator 2D: Registrations of Ultra-Low Emission Vehicles (secondary indicator)
In 2019, transport accounted for 29% of Scotland’s total greenhouse gas emissions, and emitted a total of 13.9 megatonnes (mt) of carbon dioxide equivalent (CO2e). The Scottish Government has set targets to reduce greenhouse gas emissions, measured as CO2e, by 75% by 2030 and to reach net-zero by 2045, on a 1990 baseline. The Climate Change Plan Update requires the transport sector to reduce emissions by 56% by 2030 on the 1990 baseline, to 6.5 megatonnes of CO2e.
Indicator 2A: Transport Emissions
- Greenhouse gas emissions from transport are declining overall, but at a slow rate.
Data for this section comes from the Scottish Greenhouse Gas statistics. The data shows that:
- Transport emissions have fallen from 14.88 mt of CO2e in 1990 to 13.95 mt in 2019, although there have been fluctuations in overall emissions since 1990. Since 2017, transport emissions have declined for two consecutive years.
- In 2019, cars represented 38% of the total of transport emissions, followed by domestic shipping at 14%. Heavy Goods Vehicles (HGVs) and Lights Good Vehicles (LGVs) both contributed 12% of overall emissions. In the context of transport, overall road transport accounts for 66% of emissions.
- A full breakdown of transport emissions, by source and how these have changed over time, can be found in the accompanying dataset.
Indicator 2B: Sustainable Mode Share
- Around a third of journeys are made using sustainable modes, while over half of journeys under two miles were made in this way.
Data on sustainable mode share comes from the Scottish Household Survey (2019). The breakdown by group is a product of bespoke statistical analysis undertaken by Transport Scotland. Sustainable modes refer to walking, bicycling, using the bus or using rail.
Overall
- In 2019, 33% of journeys were made using sustainable modes. Other modes, by contrast, were used in 67% of journeys.
- By journey length, 70% of journeys under 1 km were made by sustainable modes, while 48% of journeys between 1 km and 2 km were made in this way. By comparison, 18% of journeys between 5 km and 10 km were made sustainably while 13% of journeys over 40 km were made in this way.
- The median journey length in 2019 was 4.3 km, as reported in Transport and Travel in Scotland, 2019 using data from the Scottish Household Survey. Overall, most journeys are short, with 17% of journeys under 1 km and 54% under 5 km.
Journeys under two miles
- Under two miles, 54% of journeys were made using sustainable modes.
- The percentage of sustainable journeys varied by group. For those in urban areas, 54% of these journeys were sustainable, compared to 48% of these journeys in rural areas. Sustainable journeys are also more common among younger people, with 66% of the journeys of those aged 16-19 and 70% of these journeys of those aged 20-29 being made in this way. By comparison, 47% of these journeys among those aged 50-59 were made using sustainable modes. Journey modes also varied by income, with those in the lowest 30% of incomes making 62% of these journeys in this way, compared to 46% of these journeys made by those in the highest 30% of incomes.
Journeys under five miles
- Under five miles, 43% of journeys were made using sustainable modes.
- The percentage of sustainable journeys varied by group. For those in urban areas, 44% of journeys under five miles were sustainable, compared to 33% of journeys of this length in rural areas. Sustainable journeys are also more common among younger people, with 55% of the journeys made by those aged 16-19 and 56% of the journeys among those aged 20-29 being made in this way. The lowest level of sustainable journeys was among those aged 50-59, at 35%. Journey modes also varied by income, with those in the lowest 30% of incomes making 54% of their journeys under five miles in this way, compared to 34% of the journeys made by those in the highest 30% of incomes.
Indicator 2C: Movement of Freight by Mode
- Overall freight appears to falling across modes
The statistics for road, water and air freight can be found in Scottish Transport Statistics. Statistics for rail are from Transporting Scotland’s Trade. Analysis of the carbon intensity of freight modes has been produced by the UK Government (in the ‘Freighting Goods’ tab of the Conversion Factors dataset). Owing to changes in data collection, road freight data 2004 and post-2004 figures are not comparable with pre-2004 figures. For this reason, 2004 is used as the baseline year for the analysis below to provide comparisons across modes. Longer term trends can be found in the original sources for these figures, and water and air freight figures going back to 2000 are available in the dataset accompanying this report.
Road freight
- Road freight is divided into inter-Scottish freight, imports and exports.
- Inter-Scottish freight – freight with both an origin and a destination in Scotland - declined from 158.7 million tonnes in 2004 to 103.2 million tonnes in 2019.
- Scottish exports to the rest of the UK increased from 14.5 million tonnes in 2004 to 15.5 million tonnes in 2019.
- Scottish exports to outwith the UK have declined from 0.5 million tonnes to 0.4 million tonnes over the same period.
- Scottish imports from the rest of the UK have increased from 17.9 million in 2004 tonnes to 18.7 million tonnes in 2019, while imports from the rest of the world have gone from 0.3 million tonnes to 0.2 million tonnes over the same period.
Water freight
- Water freight has declined from approximately 110.4 million tonnes in 2004 to 66.8 million tonnes in 2019. This includes inbound and outbound freight. More specifically, outbound freight declined from 77 million tonnes to 46 million tonnes, while inbound freight declined from 33.4 million tonnes to 20.7 million tonnes over the same period.
Air freight
- Air freight has fallen from 80,956 tonnes in 2004 to 58,914 tonnes in 2019.
Rail freight
- In Scotland, total freight lifted by rail between April 2019 and March 2020 was 4.3 million tonnes, a fall of 3.7% (167,000 tonnes) compared to the previous financial year. While this data refers to a distinct timeframe and is therefore not strictly comparable to the statistics above, it should indicate the relative scale of rail freight compared to other modes.
Carbon Intensity of Modes
A full breakdown of the carbon intensity of different modes of freight has been published by the UK Government’s Department for Business, Energy and Industrial Strategy. The following section provides some selected examples to demonstrate the relative differences between modes.
- The highest carbon intensity is associated with refrigerated domestic cargo flights to and from the UK, which emit 4.49 kg of CO2e per tonne kilometre.
- There is considerable variation by road vehicles. Across all diesel HGVs, averagely laden HGVs have a carbon intensity of 0.11 kilograms of CO2e per tonne kilometre. By comparison, an average petrol van has a carbon intensity of 0.72 kilograms of CO2e per tonne kilometre (for diesel vans, this is 0.60 kilograms of CO2e per tonne kilometre).
- There is an wide range of water based freight transport vehicles, with differing carbon intensities. As an example, an average general cargo ship has a carbon intensity of 0.013 CO2e per tonne kilometre.
- Rail, by contrast, has a carbon intensity of 0.028 kilograms of CO2e per tonne kilometre.
Indicator 2D: Ultra-Low Emissions Vehicles (ULEV)
- ULEV registrations increased between 2010 and 2019.
As reported in Scottish Transport Statistics, ULEVs are vehicles that emit less than 75g of CO2 per kilometre. This compares to average petrol cars emissions of 168g of CO2 per kilometre and 103g for buses. The data for this section comes from data provided to the Scottish Government by the Department for Transport.
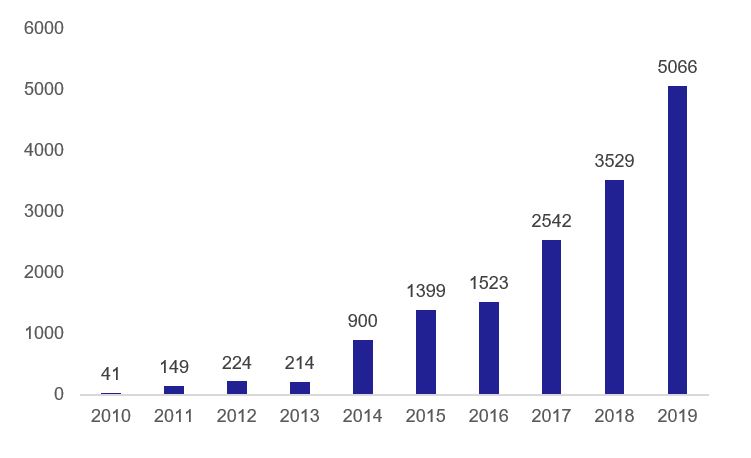
- In 2019, there were 5,066 ULEV registrations in Scotland. In this year, ULEV cars were 2.6% of all new car registrations and ULEVs overall were 2.3% of overall new vehicle registrations. In Quarter 4 2019, ULEV car registrations were 4.1% of new car registrations and ULEVs overall were 3.6% of overall new vehicle registrations.
- By contrast, in 2010, there were 41 ULEV registrations (11 of which were cars). The number of overall ULEV registrations between 2010 and 2019 is displayed in Figure 1, below. A full breakdown of the data can be found in the accompanying dataset.
< Previous | Contents | Next >