5. Motor Vehicles Traffic and Driving
Transport and Travel in Scotland Results from the Scottish Household Survey
5. Motor Vehicles Traffic and Driving
Driving Licences
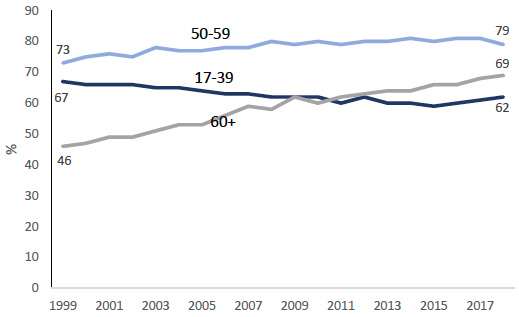
Seventy per cent of survey respondents aged 17+ had a driving licence in 2018, an increase compared with 63% in 1999 and 68% in 2008. The percentage has increased substantially for people aged over 60, but not for those aged 17 to 39, where a lower proportion of people have a licence than in 1999. [Table SUM1, Table 1, and Figure 18]
Figure 18: Percentage of adults aged 17+ holding driving licences by age band, 1999-2018
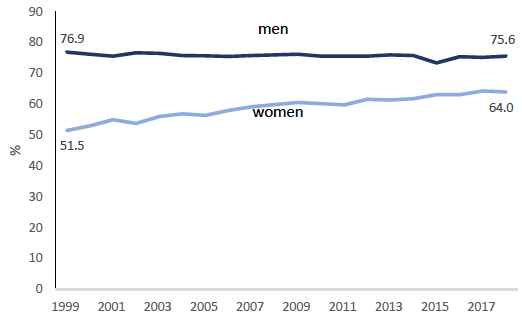
Men were more likely to hold a driving licence than women, with around three quarters (76%) of men aged 17+ having one, compared to 64 per cent of women. Since 1999, when 77% of men and 51% of women held licences, the percentage of men with licences has remained fairly stable and percentage of women has increased. [Table 1 and Figure 19]
Figure 19: Percentage of men and women over the age of 17 with driving licences, 1999-2018
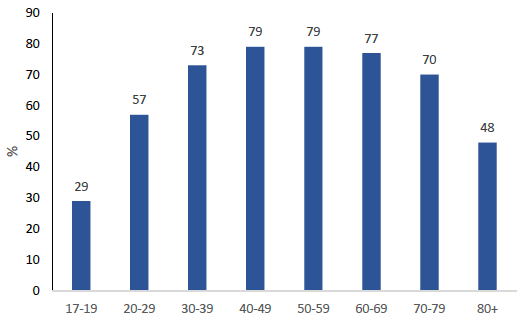
Driving licence possession was lowest amongst the youngest and oldest age groups (17-19: 29% and 80+: 48%) and highest amongst those aged 40-49 and 50-59 (both 79%). [Table 1 and Figure 20]
Figure 20: Percentage of people aged over 17 who hold a driving licence by age, 2018
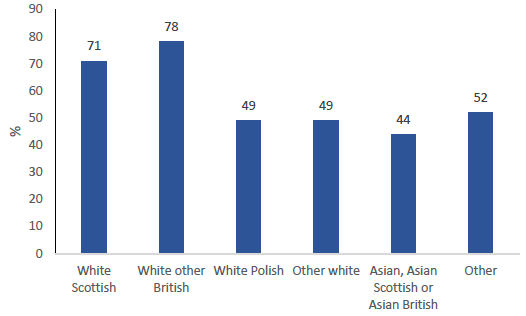
White other British (78%) and White Scottish (71%) people were more likely to hold a driving licence than other ethnic groups. For Asian, Asian Scottish and Asian British people the figure is only 44%. [Table 19 and Figure 21]
Figure 21 : Percentage of people aged over 17 who hold a driving licence by ethnic group, 2018
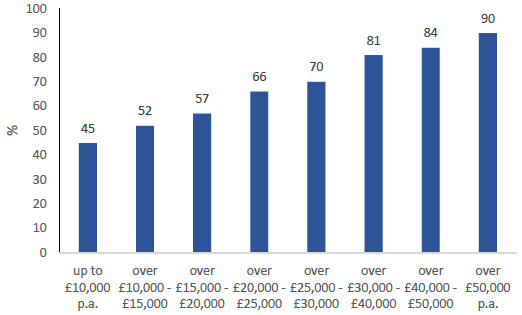
Driving licence possession increased with net annual household income (45% for adults in households with less than £10,000 of income compared to 90% in households with an income over £40,000). [Table 19 and Figure 22]
Figure 22: Percentage of people aged 17+ holding a driving licence by income, 2018
People were more likely to have driving licences in rural areas (61% of adults in large urban areas had a driving licence, compared to 82% of those in accessible rural areas). [Table 19]
Car and Van Access
Seventy one per cent of households had access to one or more cars or vans for private use in 2018. There has been an upward trend since 1999, when the figure was 63%. Twenty nine per cent of households had access to two or more cars (or vans). [Table, Table SUM1, and Figure 23]
Figure 23: Percentage of households with one or more cars, 1999-2018
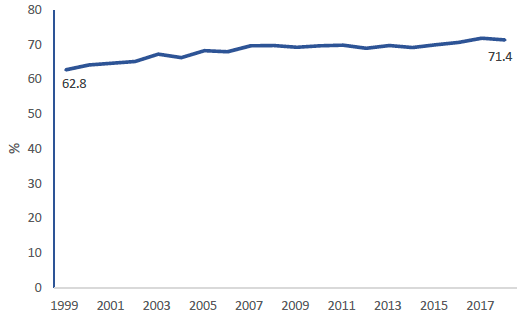
Figure 24: Household access to one or more cars by income, 2018
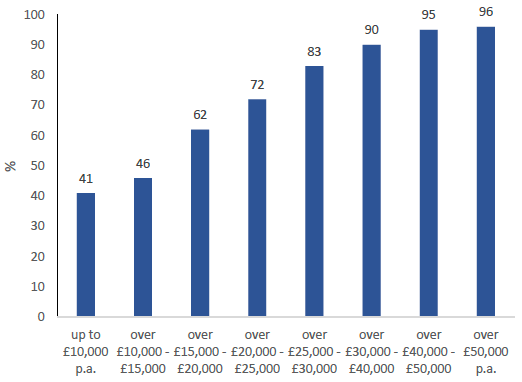
Car access increases with household income, as does the number of cars available per household: forty one per cent of households with an annual income up to £10,000 had access to one or more cars, compared to ninety six per cent of households with an annual income of more than £50,000. [Table 18 and Figure 24]
Households in rural areas were more likely to have access to a car than those in urban areas. [Table 18]
Frequency Of Driving
Sixty three per cent of those aged 17+ drove at least once a week in 2018, with 41 per cent driving every day. [Tables 20 & SUM1]
Frequency of driving was higher in rural areas than in urban areas, and increased with income. [Table 20]
Car Occupancy
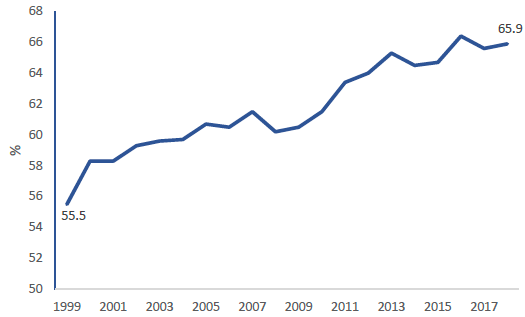
The proportion of car stages where the driver is the only occupant of the car has increased over time. In 2018, the proportion of single occupancy stages was nearly two thirds (66%) of all car stages. This contrasts with 56 per cent in 1999. [Table TD9 and Figure 25]
Figure 25: Percentage of cars stages with a single occupant, 1999-2018
The average occupancy was 1.5 people per car in 2018. [Table TD9]
Fuel Spend
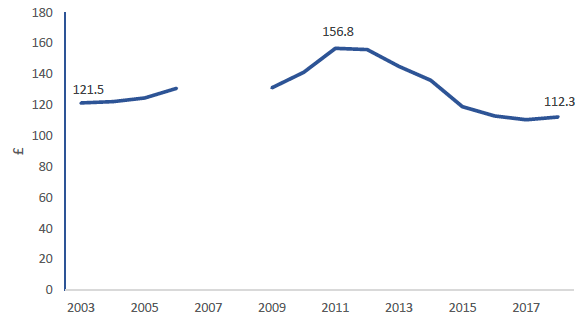
The average (mean) amount which households had spent on fuel in the last month was £112 in 2018. When adjusted for general inflation using the Retail Prices Index (RPI), this is a fall from a peak of £157 in 2011. In 2003 the inflation adjusted price was £122. [Table 2 and Figure 26]
Figure 26: Expenditure on fuel in the past month (2018 prices), 2003-2006, 2009-2018
Electric Vehicles
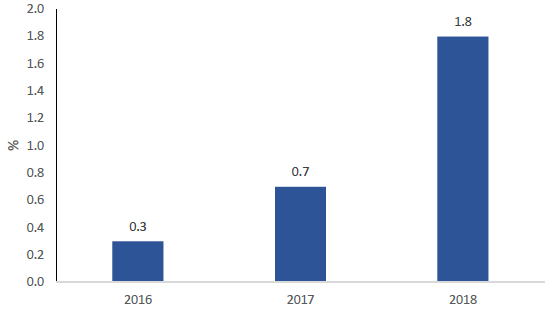
The proportion of people saying they owned an electric car or van has increased since the question was first introduced into the survey in 2016. In 2018 the figure was 1.8%, up from 0.7% in 2017 and 0.3% in 2016. [Figure 27]
Figure 27: Percentage of adults who own an electric car, 2016 to 2018
Forty four per cent of respondents said they would consider buying an electric car or van, an increase from 36% in 2016. [Table 49]
Of the people who had bought or would consider buying a plug-in electric car or vehicle, the main reasons were their environmentally friendliness (68%) and their fuel or running costs (58%) [Table 50].
For those who said they would not consider buying an electric vehicle, the distance that could be travelled on a single charge (46%) and the availability or convenience of charging points (41%) were the main deterrents. [Table 51]
More detailed statistics on vehicles licensed, the road network, road traffic and reported road vehicles in Scotland can be found in the Road Transport Vehicles Chapter of Scottish Transport Statistics.