6. Public Transport and Aviation
Transport and Travel in Scotland Results from the Scottish Household Survey
6. Public Transport and Aviation
Satisfaction With Public Transport
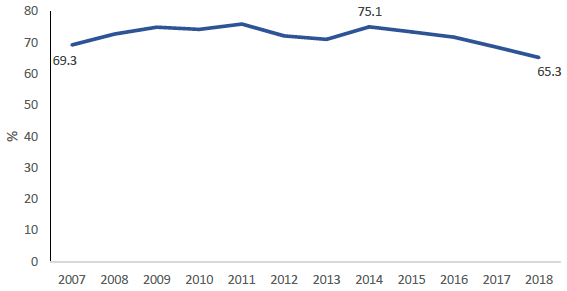
Sixty five per cent of people were very or fairly satisfied with public transport in 2018. Satisfaction has fallen in each of the last four years, from seventy five per cent in 2014. [Table 4 and Figure 28]
Figure 28: Percentage of adults ‘very satisfied’ or ‘fairly satisfied’ with public transport, 2007-2018
Local Bus Services
In 2018, 42 per cent of survey respondents had used the bus in the past month. This is similar to the percentage in 2002 (41%). [Table 28]
However there is evidence from the survey that bus users are using the bus less frequently. Amongst those that had used the bus, the percentage only using it ‘once or twice’ a month has increased since 2002 (from 11% to 15%) [Table Sum1].
Other sources suggest more clearly that bus use has been declining. Provisional estimates from DfT’s survey of bus operators indicate that there were 377 million bus journeys made in Scotland in 2018, a decrease compared with 388 million in 2017 and 471 million in 2002. [Table Sum 2]
Women tended to use buses more frequently than men (31% of women used the bus at least once a week compared to 25% of men). [Table 28]
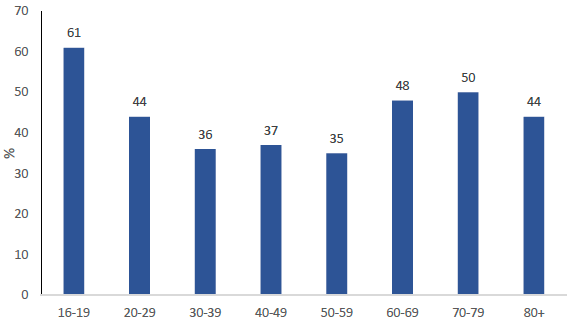
Frequency of bus use differed across age groups and was highest amongst younger people (61% of 16-19 year olds had used the bus in the last month). It was lowest for people aged 50 to 59 (35%), but higher at older ages, with fifty per cent of those aged 70 to 79 having taken the bus. [Table 28 and Figure 29]
Figure 29: Percentage of adults using the bus at least once a month, by age
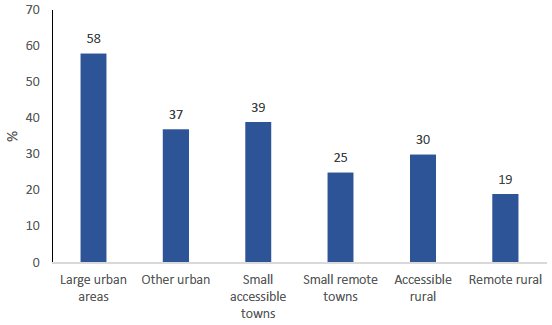
Frequency of bus use was also higher in urban areas (58% of people in large urban areas used the bus at least once a month compared to 19% in remote rural areas). [Table 28 and Figure 30]
Figure 30: Percentage of adults using the bus at least once a month, by urban rural category
The most common reasons for not using the bus more frequently were ‘Use my own car’ (26%) and ‘No need’ (19%). [Table 41]
Further bus statistics can be found in the Bus and Coach Chapter of Scottish Transport Statistics.
Bus Access
Annex B provides the results of experimental analysis on the accessibility of bus services in Scotland, carried out by the GI-SAT team in Scottish Government. The 2019 Scottish Access to Bus Indicator (SABI) gives a score for the accessibility of bus services in each data zone and provides an objective measure of accessibility to public transport by bus in Scotland.
As the maps show, weekday access to bus services is highest in urban areas, in the central belt and Aberdeen. Outside these areas, access to bus services is poorer. The results are similar for weekend access.
The tables confirm this picture. The weekday scores by quintile show that 45% of all datazones in large urban areas are in the quintile with the highest access to bus. For remote rural areas, 0% of datazones are in the highest access quintile, and 84% is in the lowest access quintile. [SABI table 3]
Rail Travel
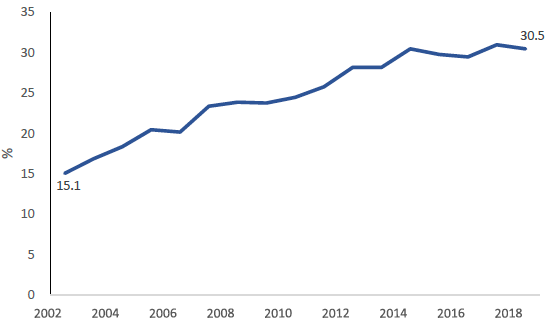
Thirty-one per cent of the population used the train in the last month. There has been an upward trend since 2002, when the figure was fifteen percent. [Table 28, Table SUM1, and Figure 31]
Passenger figures from ScotRail also show a similar trend. There were 97.8 million passengers carried by ScotRail in 2018, compared with 57.4 million in 2002. [Table SUM2]
Photo courtesy of ScotRail
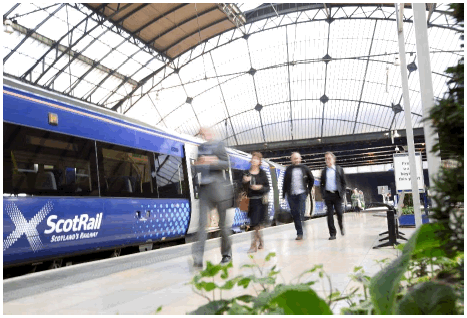
Figure 31: Percentage of adults using the train at least once in the past month, 2002-2018
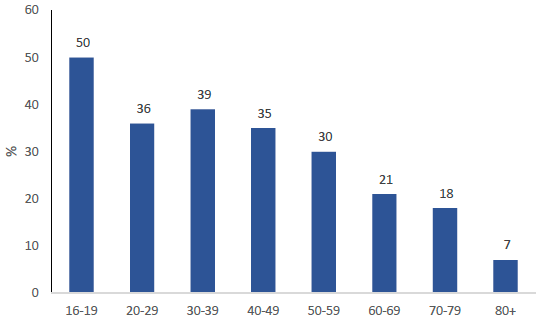
The proportion of people who reported that they had used the train in the last month decreased with age (50% of those aged 16-19 had used the train in the last month, compared to 7% of those aged 80+). [Table 28 and Figure 32]
Figure 32: Percentage of adults using the train at least once in the past month by age, 2018
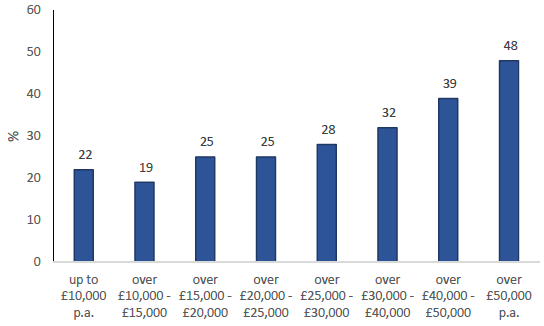
Train use was higher in higher income households (48% of those interviewed with a household income of over £50,000 had used the train in the last month, compared to 19% for those in households with an income of £10,000-£15,000). [Table 28 and Figure 33]
Figure 33: Percentage of adults using the train at least once in the past month by income, 2018
Of those who had used the train in the last month, the most frequent journey purpose was shopping (33%), followed by visiting friends or relatives (26%) and other recreational activities (23%). [Table 44]
Detailed rail statistics can be found in the Rail Chapter of Scottish Transport Statistics.
Aviation
Fifty one percent of adults took at least one flight for leisure in 2018. This is an increase from 2009 (47%) when the question was first asked. [Table 37 and Figure 34]
Eight per cent of adults took at least one flight for business. This is similar to the 2009 figure of 9% [Table 38].
Figure from the Civil Aviation Authority show an increase in the number of air terminal passengers (passengers joining or leaving aircraft at Scottish airports) between 2009 and 2018 (from 22.5 million to 29.4 million). [Table SUM2]
Figure 34: Percentage of adults taking flights for leisure, 2009-2018*
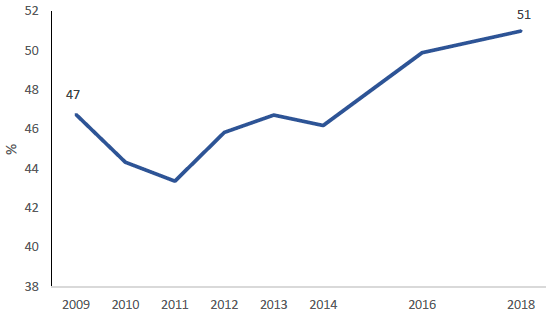
*The question was not asked in 2015 and 2017
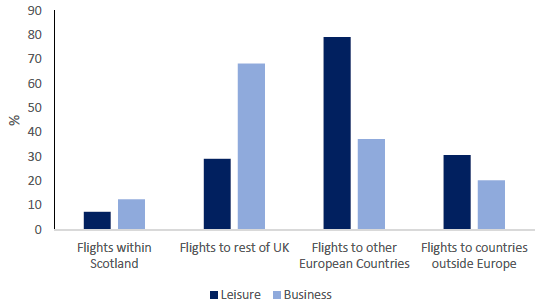
Of those who had flown flights to Europe were most common for leisure travellers (79% flew at least once to Europe). For business flyers, flights to the rest of the UK were most common (68% flew at least once to the rest of the UK). [Tables 37a, 38a, and Figure 35]
Figure 35: Percentage of those who flew who took at least one flight to a destination area, leisure and business users
By far the two most common reasons for flying was that it was quicker (79%) and cheaper (30%). [Table 39]
Detailed aviation statistics can be found in the Aviation Chapter of Scottish Transport Statistics.