Walking and cycling
Walking and cycling
Walking
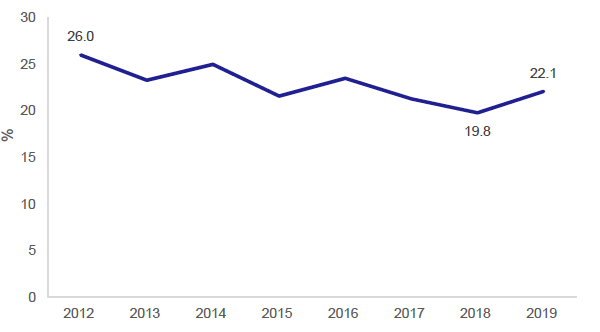
Of all journeys reported in the SHS travel diary, twenty two per cent had walking as the main mode. This is an increase from twenty per cent in 2018, although less than in the first comparable year, 2012, where twenty six percent of journeys were by foot. [Table Sum 1 and Figure 33]
Figure 33: Percentage of journeys with walking as the main mode, 2012-2019
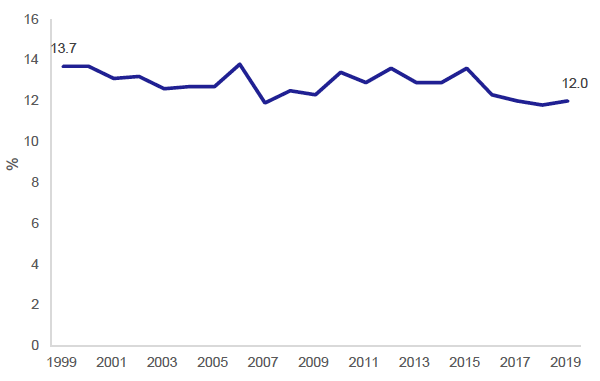
Twelve per cent of adults usually walked to work. This is similar to the figure for the previous three years, but a little lower than for most years since 1999, when the figure was 14% [Tables 7, TD2 & SUM1, and Figure 34].
Figure 34: Percentage of adults walking to work, 1999-2019
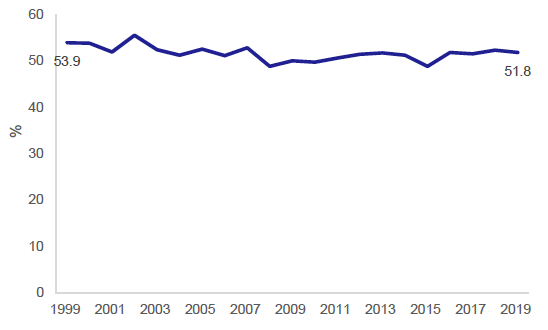
Fifty two per cent of children usually walked to school as their main mode of transport, compared to 50% in 2009, and 54% in 1999. [Tables 15, TD2 & SUM1 and Figure 35].
Figure 35: Percentage of children walking to school, 1999-2019
The average (median) walking journey was 1.0 km using road network distance. [Table TD5a]
Cycling
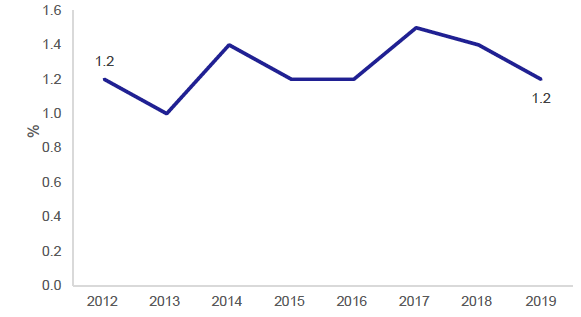
Of all journeys reported in the SHS travel diary, 1.2% were by bicycle. This figure has changed little since 2012, when comparable records began. [Table 1 & Sum 1 and Figure 36
Figure 36: Percentage of journeys with cycling as the main mode, 2012-2019
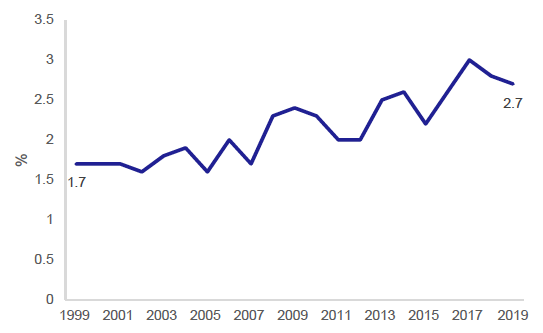
2.7 per cent of adults usually cycle to work. This is similar to figures from the previous three years. There has been an upward trend in since 1999, when the figure was 1.7%. [Figure 37].
Figure 37: Percentage of adults who cycled as their usual method of travel to work, 1999-2019
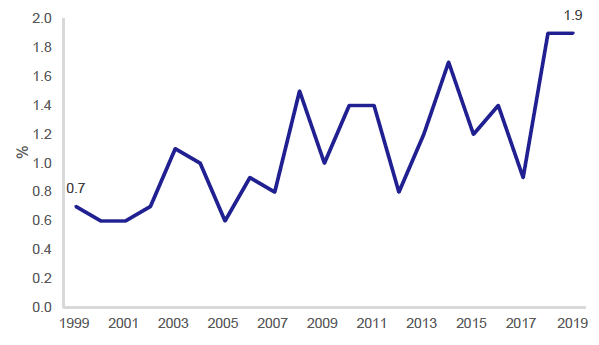
1.9% of children cycled to school. There has been an upward trend since 1999, when the figure was 0.7%. [Tables 15, SUM1, and Figure 38]
Figure 38: Percentage of children who cycled as their usual method of travel to school, 1999-2019
The average (median) cycling journey was 2.7 km using road network distance. [Table TD5a]
Bicycle access
Just over a third (34%) of households had access to at least one bicycle for adult use in 2019. Eighteen per cent had access to two or more. [Table 18]
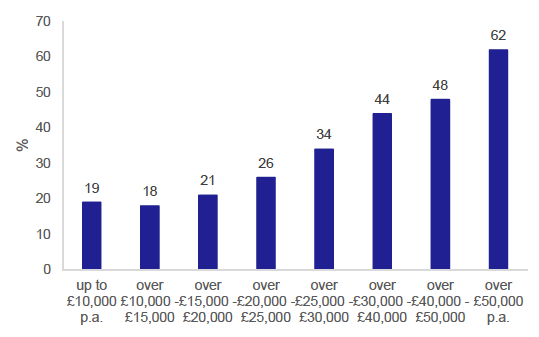
Household access to bikes increased with household income and household size; 62% of households with an income of £50,000 or more have access to one or more bikes, compared to 19% of households with an income up to £10,000, and 18% with an income of £10,000 to £15,000. Bicycle access was higher in rural areas than urban areas. [Table 18 and Figure 39]
Figure 39: Access to one or more bicycles in household, by income, 2019
